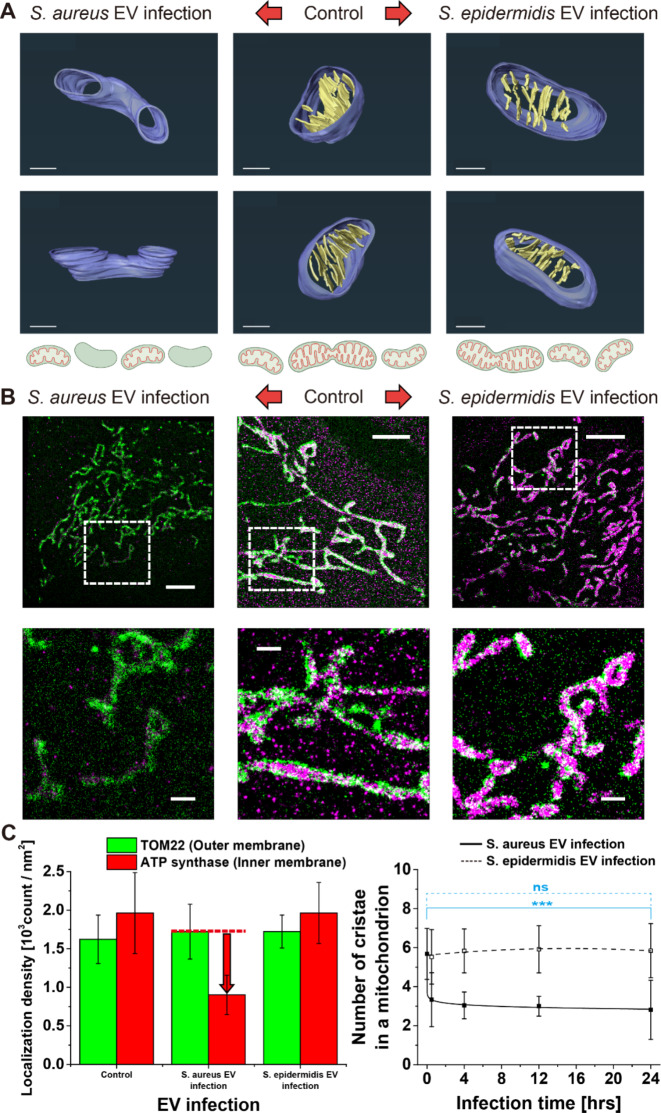
Fig. 2.
Loss of cristae by S. aureus EV infection. (A) 3D reconstructed HVEM images of epithelial keratinocyte (HaCaT) cells treated with S. aureus (left) or S. epidermidis (right) EVs after 30 min of EV infection at different angles, showing the loss of cristae by S. aureus EV infection. Schematic diagrams are shown together. (B) Representative two-color STORM images showing the outer membrane protein TOM22 of mitochondria (green) and cristae immunolabeled for ATP synthase (magenta) in HaCaT cells treated with S. aureus (left) or S. epidermidis (right) EVs after 30 min of EV infection. Enlargement of the boxed region is shown together at the bottom. (C) Quantitative analysis of the outer membrane protein and cristae using their mean localization densities in a mitochondrion from STORM images (n = 10, mean ± SD) and for the number of cristae in a mitochondrion from TEM images. (n = 10, mean ± SD) (ns: p > 0.05, ***p < 0.001) Scale bars: (A) 300 nm. (B) 5 μm (top), 1 μm (bottom)

