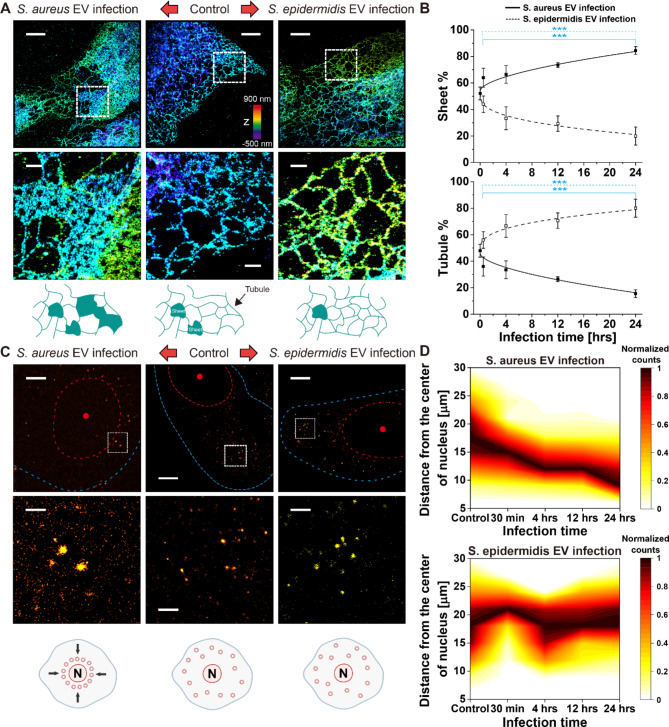
Fig. 3.
Transformation of endoplasmic reticulum (ER) between sheet and tubular structures by EV infection. (A) Representative STORM images of ER in epithelial keratinocyte (HaCaT) cells treated with S. aureus EVs (left) or S. epidermidis EVs (right) after 30 min of EV infection. Enlargement of the boxed region is shown at the bottom. Schematic diagrams are shown together. (B) Quantitative analysis of the ultrastructural changes of the ER in terms of the percentage of sheet-like and tubular structures. (n = 10, mean ± SD) (C) Representative STORM images of lysosomes in HaCaT cells treated with S. aureus EVs (left) or S. epidermidis EVs (right) after 30 min of EV infection. Enlargement of the boxed region is shown together at the bottom. Schematic diagrams are shown together. Dashed lines: cell membrane boundary (blue) and nucleus boundary (red). (D) Quantitative analysis of the radial distribution of lysosomes from the center of the nucleus. (n = 10) (ns: p > 0.05, ***p < 0.001) Scale bars: (A) 5 μm (top), 1 μm (bottom). (C) 5 μm (top), 1 μm (bottom)

