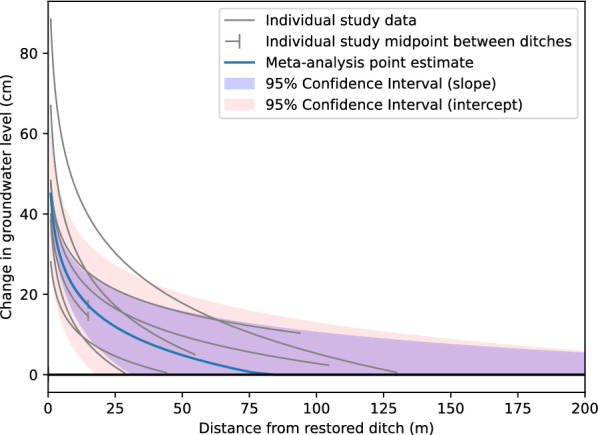
Fig. 8.

Peatland restoration effects at different distances (excluding blanket peatlands). Individual study (n = 8) and random effects (RE) model relationship y = m ln x + b between distance from restored ditch (x, measured in m) and change in groundwater level (y, measured in cm). Each gray line corresponds to the relationship established from reported effects in an individual study. Vertical bars indicate end points for transects that are between ditches, typically coinciding with midpoints between ditches. The blue line is the RE model point estimate based on all studies. The purple band shows the 95% confidence interval of the RE model estimate of the slope parameter (m). The pink band shows the 95% confidence interval of the RE model estimate of the intercept (b) parameter
