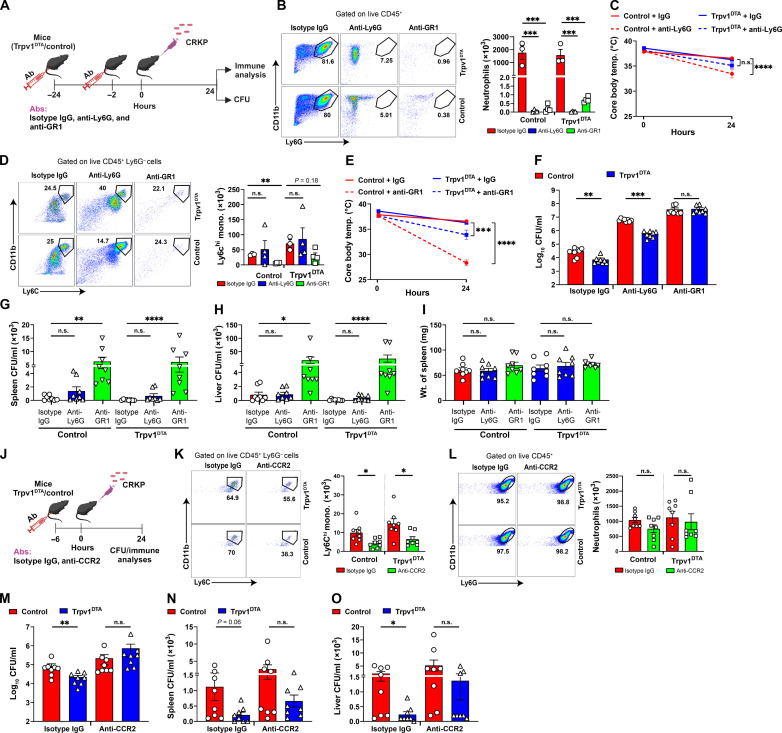
Fig. 6. Monocytes are critical for the control of CRKP dissemination and pneumonic sepsis.
(A) Schematic showing depletion of neutrophils and monocytes and CRKP infection. (B and D) Flow cytometry plots, total neutrophils (B), and total monocytes (D) in isotype immunoglobulin G (IgG)–, anti-Ly6G–, and anti-GR1–treated control and Trpv1DTA mice (n = 3 to 4 per group) at 24 hpi. (C and E) Core body temperature of isotype IgG–treated versus anti-Ly6G–treated mice [(C), n = 8 per group] and isotype IgG–treated versus anti-GR1–treated mice [(E), n = 8 per group] over time. n.s., not significant. (F to I) CFUs in BALF (F), spleen (G), and liver (H) and weight of spleen (I) in neutrophil/monocyte-depleted Trpv1DTA and control mice (n = 8 per group) at 24 hpi. (J) Schematic showing anti-CCR2–mediated depletion of Ly6Chi monocytes and CRKP infection. (K and L) Flow cytometry plots, total Ly6Chi monocytes (K), and total neutrophils (L) in isotype IgG– and anti-CCR2–treated Trpv1DTA and control mice (n = 8 per group) at 24 hpi. (M to O) CFUs in BALF (M), spleen (N), and liver (O) in monocyte-depleted Trpv1DTA and control mice (n = 8 per group) after 24 hpi. Data in (B) to (I) and (K) to (O) are the means ± SEM. Statistical analysis: one-way ANOVA with Holm-Sidak’s comparisons posttests [(B) and (I)], Brown-Forsythe and Welch ANOVA with Dunnett’s T3 multiple comparisons posttests (D), repeated measures two-way ANOVA with Sidak’s comparisons posttests [(C) and (E)], Mann-Whitney test [(F) and (M) to (O)], Kruskal-Wallis test with Dunn’s multiple comparisons test [(G) and (H)], and unpaired t test [(K) and (L)]. Level of significance: *P < 0.05, **P < 0.01, ***P < 0.001, ****P < 0.0001. BioRender.com was used to create schematics in (A) and (J).

