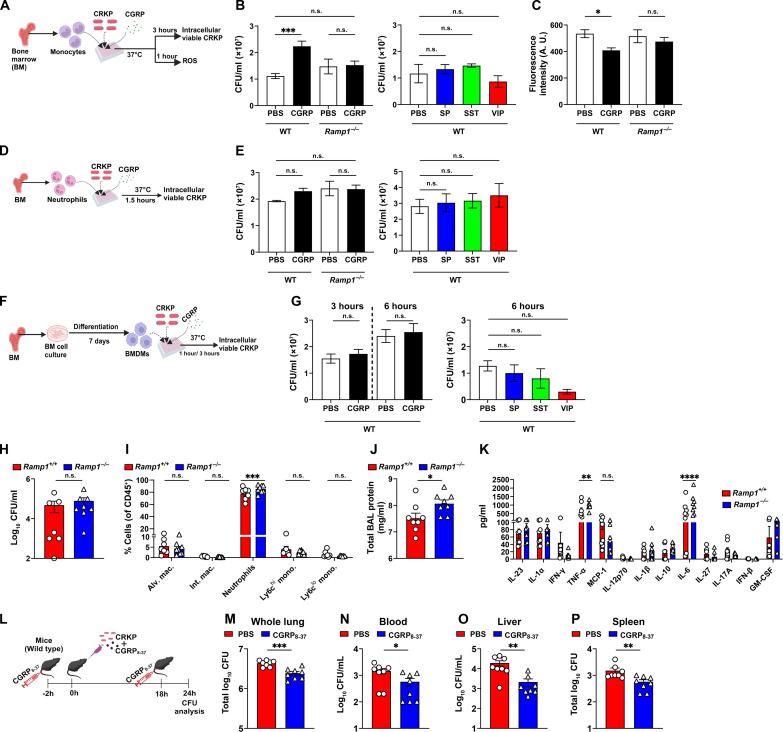
Fig. 8. CGRP-RAMP1 signaling dampens anti-CRKP response in monocytes.
(A) Schematic showing monocyte and CRKP coculture in the presence and absence of neuropeptide. (B and C) Intracellular viable CFUs (B) and levels of ROS (C), in CRKP-infected wild-type (WT) and Ramp−/− monocytes. (D) Schematic of neutrophil and CRKP coculture with and without neuropeptide. (E) Intracellular viable CFUs in CRKP-infected WT and Ramp−/− neutrophils. (F) Schematic showing BMDM isolation and coculture with CRKP in the presence and absence of neuropeptides. (G) Intracellular viable CFUs in WT BMDMs. Data in (B), (C), (E), and (G) involve three to eight samples per group. (H to K) CRKP CFUs (H), proportions of myeloid subsets (I), total BAL protein (J), and panel of 13 mouse inflammatory cytokines/chemokines (K), measured in BALF of Ramp1+/+ and Ramp1−/− mice (n = 7 to 8 per group) at 24 hpi. (L) Schematic showing administration of CGRP8–37 (5 μg per mouse) in C57BL/6 J mice and CRKP infection. (M to P) CFUs in whole lung (M), blood (N), liver (O), and spleen (P) of PBS-treated and CGRP8–37-treated mice (n = 8 per group) after 24 hpi. Data in (B), (C), (E), (G), (H) to (K) and (M) to (P) are the means ± SEM. Statistical analysis: one-way ANOVA with Sidak’s multiple comparisons posttests [(B), (C), (E), and (G)], Mann-Whitney test [(H), (O), and (P)], unpaired t test [(J), (M), and (N)], and two-way ANOVA of two-stage liner step-up procedure of Benjamini, Krieger, and Yekutieli posttests [(I) and (K)]. Levels of significance: *P < 0.05, **P < 0.01, ***P < 0.001, ****P < 0.0001. BioRender.com was used to create schematics in [(A), (D), (F), and (L)].

