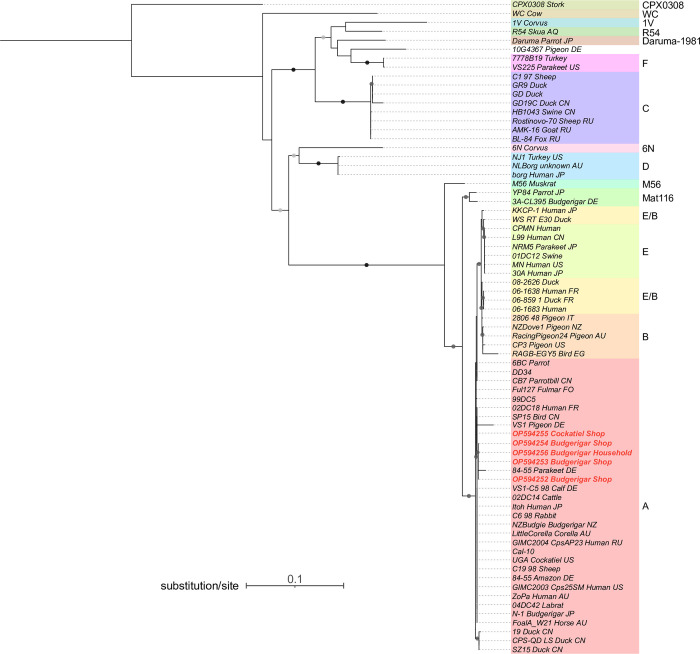
Fig 1. Phylogenetic tree constructed using Chlamydia psittaci ompA gene sequences.
The tree includes sequences obtained from positive samples in this study (shaded in light red) as well as sequences retrieved from PubMLST and GenBank [45]. Sequences discovered in this study are shown in red font. Node labels consist of strain names followed by the host species and the sampled country, whenever available. Bootstrap values of 60 or above are presented as round shapes on the branches. Light grey shapes indicate bootstrap values above 60 and below 79, dark grey shapes indicate values above 80 and below 100, while black shapes represent a value of 100.

