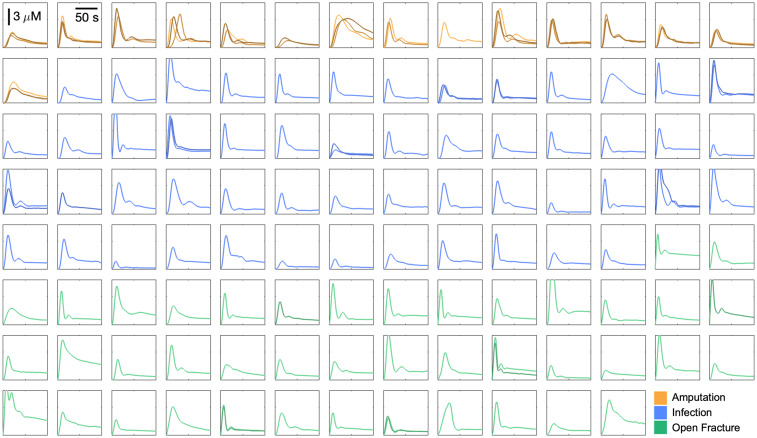
Fig. 4.
A total of 144 arterial input functions from 110 patients across three patient cohorts. The -axis is the concentration in micromolars, and the -axis is the time in seconds. All traces are displayed with the same scale, shown by scale bars in the top left corner. For panels with more than one trace, each serial ICG injection is displayed with an increasingly darker shade.

