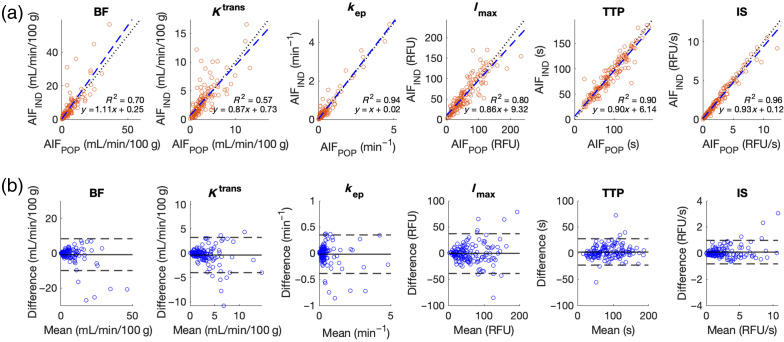
Fig. 9.
Comparison of and in perfusion-related kinetic parameters. Rows, from top to bottom, feature the regression plots (black dotted line: identity; blue dashed line: linear regression) and Bland–Altman plots (solid line: mean difference; dashed line: limits of agreement), respectively. Columns, from left to right, show the results from BF, , , , TTP, and IS.

