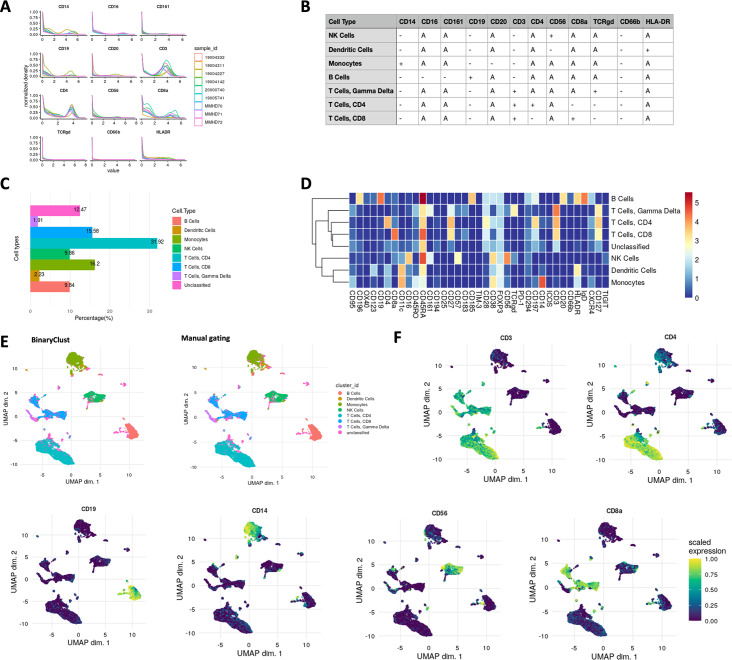
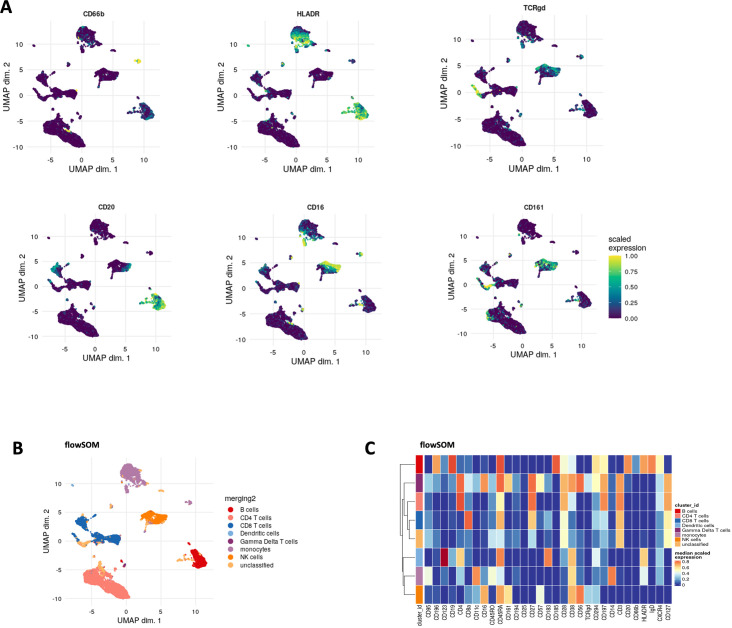
Figure 5. Cell type characterisation and visualisation using ImmCellTyper pipeline in myeloproliferative neoplasm (MPN) dataset (n = 9).
(A) Intensity distribution of selected phenotypic markers used for BinaryClust classification, coloured by sample_id. (B) Pre-defined expression classification matrix for the MPN dataset, ‘+’ indicates positive, ‘-’ indicates negative, and ‘A’ suggests ‘any’. (C) Proportion of the main cell lineages of all cells in the concatenated FCS files after classification. (D) Median marker expression heatmap of BinaryClust classification results. (E) UMAP plot of random downsample of 2000 cells per patient coloured by main cell types based on BinaryClust classification (left) and manual gating results (right). (F) UMAP plots coloured by normalised expression of indicated markers (CD3, CD4, CD8a, CD20, CD19, CD14, and CD56) across 2000 cells per sample.


