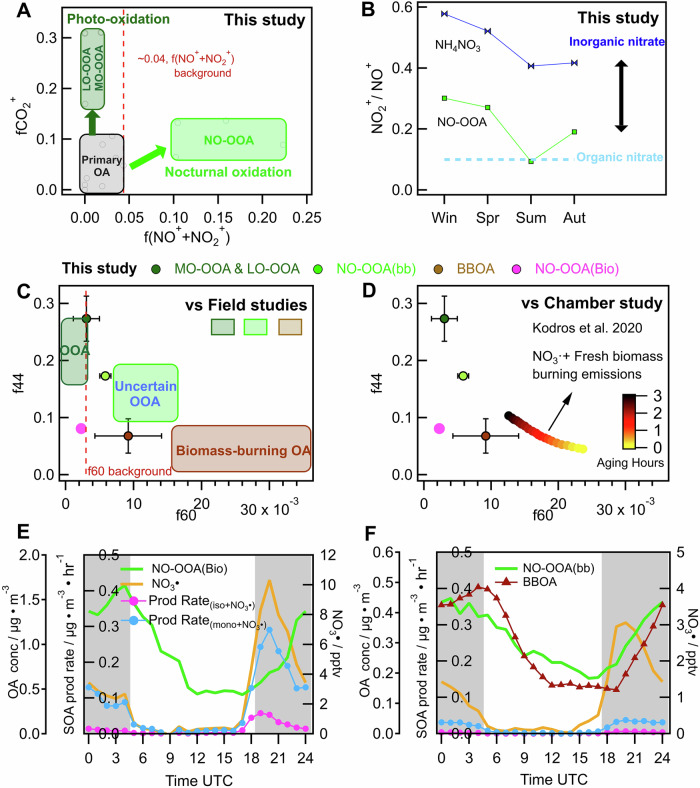
Fig. 2. Analysis of chemical characteristics and formation mechanism of nocturnal OOA.
A Directly emitted primary OA, OOA formed from photo-oxidation (LO-OOA and MO-OOA) and nocturnal oxidation processes (NO-OOA) resolved by the PMF analysis of particulate nitrate and organic aerosol measurements during the JULIAC campaign. The ratio of the ion mass signals of the fragments CO2+ (fCO2+) vs the sum of NO+ and NO2+ (f(NO+ + NO2+)) normalized to the total ion mass signal intensity is used to show the distribution of nitrate-containing OA factors. These OA factors fall in fCO2+ vs f(NO+ + NO2+) space and are represented by gray circles and categorized by the grey, dark green, and light green rectangles respectively, with a detailed graph in Supplementary Fig. 25. The value of f(NO+ + NO2+) (<0.04) of primary OA and photo-oxidation OOA is marked as background by a red dashed line. B The ratio of nitrate fragments (NO2+/NO+) in NO-OOA across seasons is shown by green markers with line, while blue markers with line represent the ratio of inorganic ammonium nitrate particles (NH4NO3). The blue dashed line represents the reference ratio of pure organic nitrate24. C The chemical composition, characterized mass spectrum characteristics of f44 vs f60, is used to compare the averaged PMF factors from this study (shown as circle with error bar) to those from previous field studies9,20,52,53 (depicted as rectangles). These studies all identified an unexplained nocturnal OOA, daytime OOA, and primary BBOA, highlighted by light green, dark green, and brown rectangles, respectively. Detailed factor positions are provided in Supplementary Fig. 25. The background value of f60 (~0.3%) for atmospheric OA87,88 is marked by a red dashed line. Additionally, (D) compares the averaged OA factors obtained in this study to the OA evolution during the dark oxidation of biomass-burning emission by NO3· in a chamber study87,88, illustrated with dotted line color-coded by aging time. The seasonal averaged diurnal pattern of the mass concentration of the NO-OOA, BBOA, NO3·, and SOA production rate of the NO3· reaction with monoterpenes and isoprene are shown for summer (E) and spring (F). The grey areas represent nighttime.

