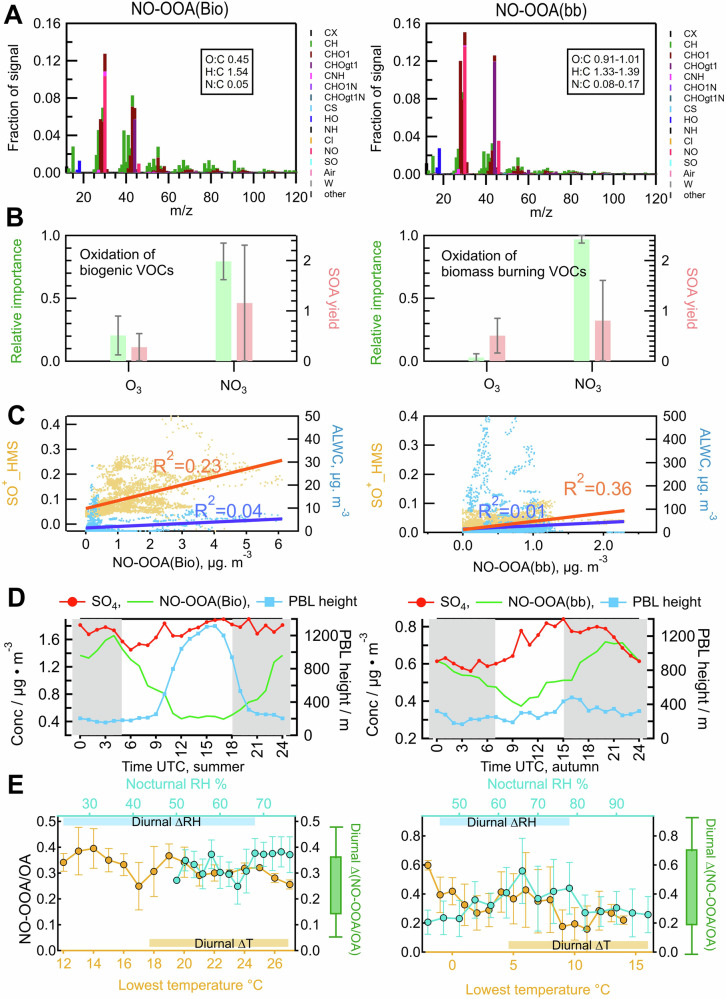
Fig. 3. Analysis of atmospheric layer development, phase-partitioning, and chemical reactions on the enhancement of nocturnal OOA.
A The ion mass spectrum of NO-OOA(Bio) for summer and an averaged spectrum of NO-OOA(bb) for the other seasons (detailed spectra in the Supplementary Fig. 7) obtained by the PMF analysis of measurements of aerosol nitrate and organics. B Competition between NO3 and O3 oxidation of VOCs (label as relative importance (green)) and the comparison of secondary organic aerosol (SOA) yield of biogenic VOCs (BVOCs) (isoprene, α-pinene, β-pinene, and limonene) and biomass-burning volatile organic compounds (bbVOCs) (furan, naphthalene) by different oxidants (NO3 and O3) (red), with the median values represented by the bars and the range of variability indicated by the error bars. (Supplementary Table 2). C Correlation of NO-OOA(Bio) and NO-OOA (bb) with the SO+ fragment originating from HMS and aerosol liquid water content (ALWC). D Averaged diurnal variations of the sulfate (SO4) aerosol mass concentrations and observed NO-OOA obtained by the PMF analysis, as well as the PBL height obtained from the EURAD-IM in summer and autumn during the JULIAC campaign. Plots showing results for the other seasons can be found in the Supplementary Fig. 18. E The variation of mass ratio of NO-OOA (Bio) to total OA in summer, and NO-OOA (bb) to total OA in the other seasons as a function of the minimum nocturnal temperature and corresponding relative humidity during these periods. Data is restricted to the period ±2 hours of the minimum temperature. The averaged diurnal variations of temperature, RH, and the ratio of NO-OOA/OA are also displayed in the plot by yellow, blue, and green bars, respectively.

