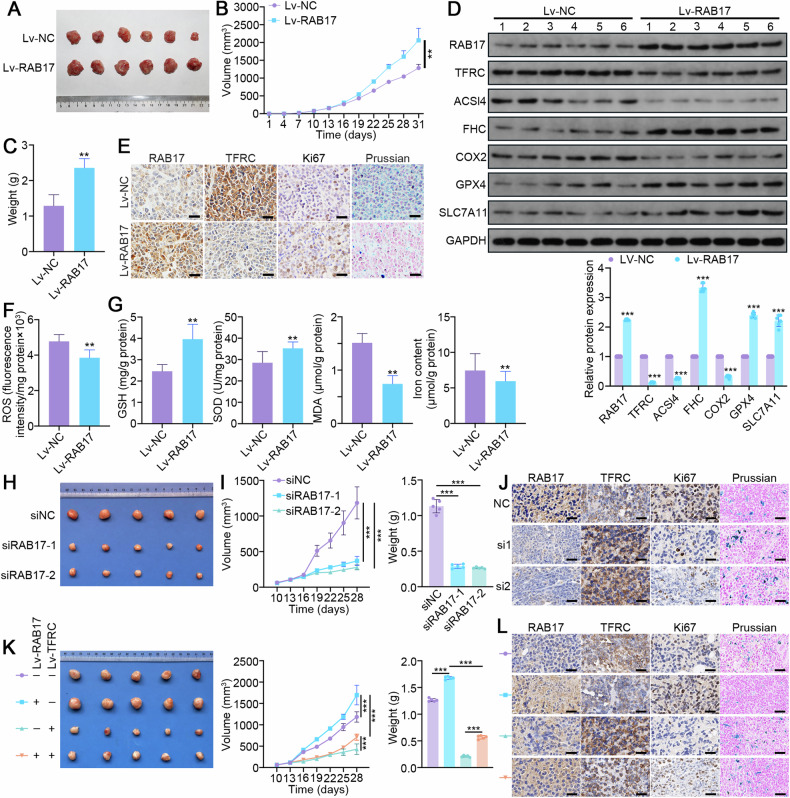
Fig. 7. RAB17 regulates ferroptosis in ECs in vivo.
A Representative images of the xenografts, (B) tumor volume, and (C) tumor weight 31 days after inoculation of Ishikawa cells infected with Lv-NC or Lv-RAB17 (n = 6 per group). The tumor volumes were measured every 3 days. D Western blot analysis of RAB17 and TFRC expression in Lv-NC and Lv-RAB17 xenografts. E Representative images of immunohistochemical staining for RAB17, TFRC, and KI67, as well as Prussian blue staining, of Lv-NC and Lv-RAB17 xenografts. Scale bars, 100 μm. F ROS levels in Lv-NC and Lv-RAB17 xenografts. G GSH, SOD, MDA, and iron levels in Lv-NC and Lv-RAB17 xenografts. H Western blot analysis of designated ferroptosis marker proteins in Lv-NC and Lv-RAB17 xenografts. GAPDH was used as an internal control. H Representative images of the xenografts, (I) tumor volume, and weight 28 days after inoculation of Ishikawa cells infected with siNC or siRAB17 (n = 5 per group). The tumor volumes were measured every 3 days. J Representative images of immunohistochemical staining for RAB17, TFRC, and KI67, as well as Prussian blue staining, of siNC or siRAB17 xenografts. Scale bars, 100 μm. K Representative images of the xenografts, tumor volume, and weight 28 days after inoculation of Ishikawa cells infected with indicated vectors (n = 5 per group). The tumor volumes were measured every 3 days. L Representative images of immunohistochemical staining for RAB17, TFRC, and KI67, as well as Prussian blue staining, of indicated xenografts. Scale bars, 100 μm. All the above assays were independently performed in triplicate (N = 3). The data are presented as the means ± SDs. The statistical analyses were performed by two-tailed unpaired Student’s t tests. **P < 0.01, and ***P < 0.001.

