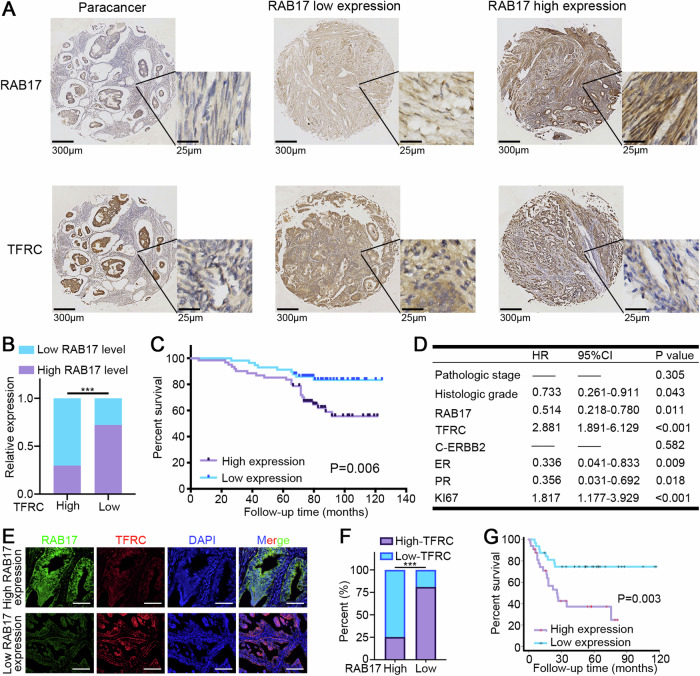
Fig. 8. RAB17 and TFRC expression levels are significantly associated with prognosis in patients with EC.
A Representative IHC images of RAB17 and TFRC expression in 118 EC tissues. The right panels (scale bars = 25 μm) show magnified views of the boxed area in the corresponding left panels (scale bars = 300 μm). B Chi-square test based on the immunohistochemical analysis of RAB17 and TFRC expression. C The overall survival (OS) of EC patients with different RAB17 protein expression levels were assessed by Kaplan–Meier survival curves and log-rank tests. D Multivariate analysis of factors associated with overall survival in patients with EC. E Representative immunofluorescence images of RAB17 and TFRC expression in 86 EC tissues from our cohort. F Correlation analysis between RAB17 and TFRC expression, chi-square test was used. G The overall survival (OS) of 86 EC patients from our cohort with different RAB17 protein expression levels were assessed by Kaplan–Meier survival curves and log-rank tests. ***P < 0.001.

