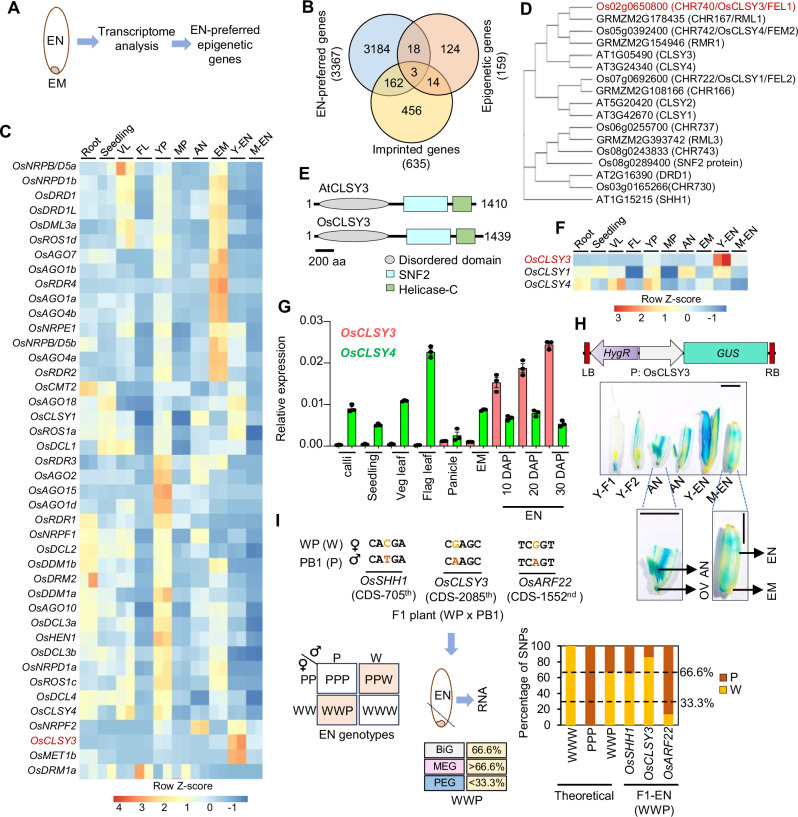
Fig. 1. OsCLSY3 is an endosperm-preferred imprinted gene.
A Schematic showing EM (embryo) and EN (endosperm) tissues taken for transcriptome analysis. B Venn diagram showing overlap between epigenetic genes, EN-preferred genes and all known imprinted genes. C Heatmap depicting tissue-specific expression of epigenetic genes. Root (GSE166669), seedling (GSE229604), VL vegetative leaf (GSE229604), FL flag leaf (GSE111472), YP young panicle (GSE180457), MP mature panicle (GSE107903), AN anther (GSE180457), Y-EN young EN (15 days after pollination—DAP), M-EN mature EN (25 DAP) (GSE229961). Row Z-score was plotted. D Phylogenetic tree for DRD1 family proteins in Arabidopsis, rice and maize. 1000 bootstrap replications. E Domain architecture of CLSY3 proteins (predicted). F Expression of rice CLSYs across tissues (RNA-seq). G RT-qPCR analysis of OsCLSY3 and OsCLSY4 across different tissues. OsActin served as an internal control. Data represent means ± standard error (SE). n = 3. Experiment was repeated at least twice with independent samples and consistent results were obtained. H Vector map of P: OsCLSY3: GUS, and GUS expression pattern across reproductive tissues. Y-F1—spikelet before anthesis, Y-F2—spikelet 1 d before pollination, OV—unfertilized ovule. Scale bar (SB)—1 mm. I Scheme depicting WP and PB1 cross, and the SNPs identified in CDS of OsARF22 (PEG), OsCLSY3 (putative MEG) and OsSHH1 (BiG). Punnett square showing possible EN genotypes. Transcript contribution from the WWP genotype seeds is shown for imprinted genes. Stacked barplots showing theoretical and observed transcript contribution of three genes in WWP EN. Dotted lines indicate the theoretical percentage of maternal and paternal SNPs. Source data are provided as a Source Data file.

