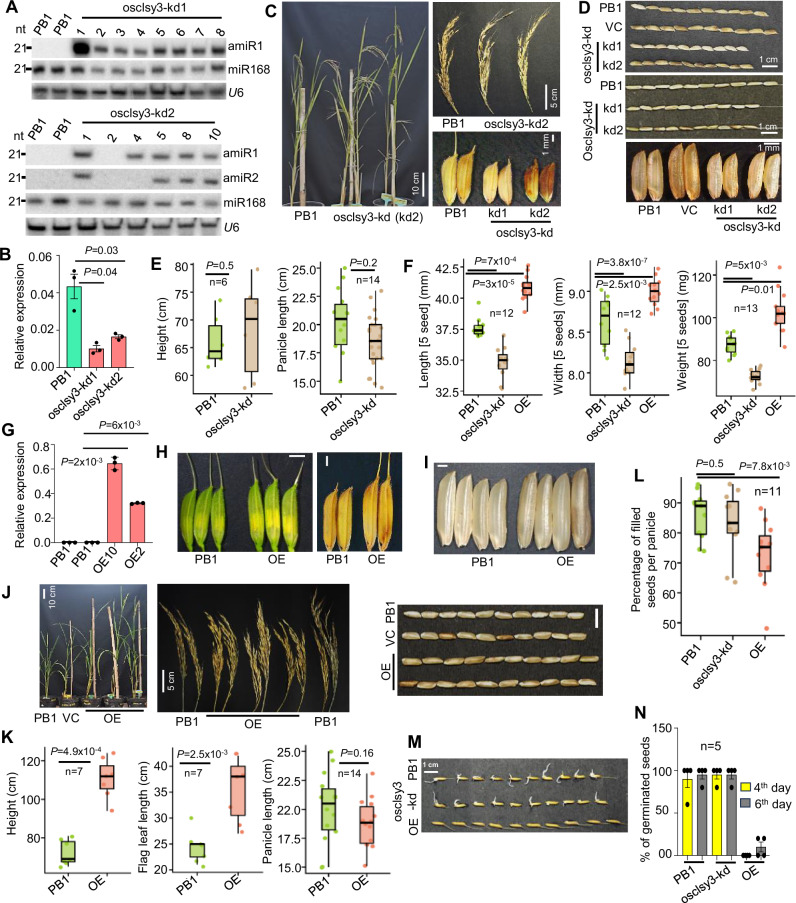
Fig. 3. Phenotypes of osclsy3-kd and OE lines.
A Northern blots showing expression of amiRs. B Barplot showing levels of OsCLSY3 expression in osclsy3-kd EN. OsActin served as internal control. Data represents mean ± SE of 2 independent transgenic lines with 3 technical replicates each. Experiments repeated more than twice. Comparisons were made with paired two-tailed Student’s t-tests (P < 0.05 was considered significant). C Images showing morphology of osclsy3-kd plants, panicles and seeds when compared to equally grown PB1. D Seed morphology of osclsy3-kd with and without de-husking. E Boxplots showing height and panicle length of osclsy3-kd plants. Boxes show median values and interquartile range. Whiskers show minimum and maximum values, data points were represented as round dots. Two-tailed Student’s t-test (P < 0.05 was considered significant). F Boxplots showing five seeds length, width and weight in osclsy3-kd. G Barplot showing expression of OsCLSY3 in OE plant leaves. OsActin served as internal control. Data represents mean ± SE of 2 independent transgenic lines with 3 technical replicates each. Experiments repeated three times. Two-tailed Student’s t-test (P < 0.05 was considered significant). H Images showing spikelet and seed morphology in OE. (SB—1 mm). I Images showing de-husked OE seeds (SB—1 mm). J Images showing morphology of OE plants, panicles and seeds (with and without de-husking) compared to PB1. K Boxplots showing height, flag leaf and panicle length of OE plants. PB1 panicles were the same ones used in 4E. L Boxplot showing percentage of seed filling in OE and osclsy3-kd plants. M Image showing seed germination across OsCLSY3 mis-expression lines. N Percentage of germinated seeds in OsCLSY3 genotypes. Data represents mean ± SE of 4 biological replicates with n = 5 seeds each, and the assay was repeated twice. Source data are provided as a Source Data file. All experiments were repeated at least twice with consistent results.

