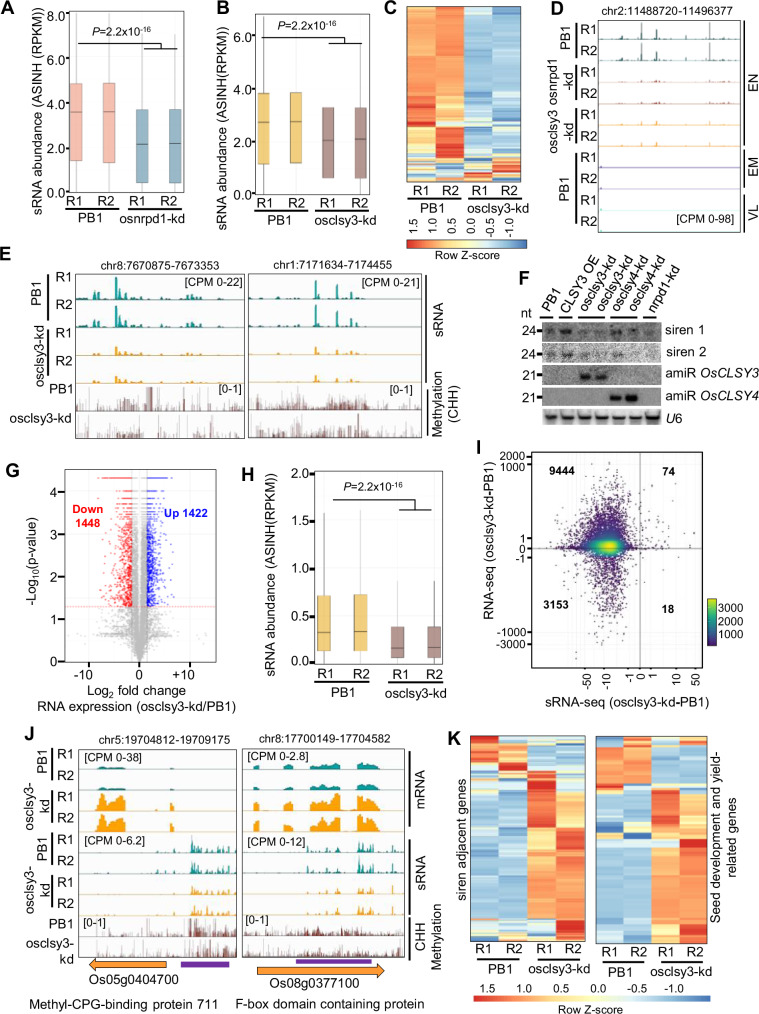
Fig. 6. OsCLSY3 controls expression of siren loci and development-related genes.
A Boxplot showing sRNAs (23–24 nt) derived from siren loci in osnrpd1-kd EN (797 loci). ASINH converted RPKM values were used for boxplot. B Boxplot representing status of sRNAs (23–24 nt) from siren loci in osclsy3-kd EN. C Heatmap showing siren sRNAs in osclsy3-kd EN. Row Z-score was plotted. D IGV screenshot showing expression of siren loci in osclsy3-kd and osnrpd1-kd EN. VL vegetative leaf. E IGV screenshots showing expression of siren sRNAs and DNA methylation in osclsy3-kd EN. F Northern blot showing siren sRNAs in RdDM mutants. G Volcano plot representing all DEGs of osclsy3-kd. H Boxplot showing sRNA levels near DEGs. I Correlation plot showing accumulation of CLSY3-dependent sRNAs and mRNA expression of adjacent genes (RPKM). J IGV screenshots showing expression of two selected DEGs and levels of adjacent sRNA loci in osclsy3-kd EN (violet lines mark DNA hypomethylated regions). K Heatmap showing expression of genes adjacent to siren loci (510) and seed development (102) genes. Row Z-score was plotted. In (A), (B) and (H), boxes show median values and interquartile range. Whiskers shows minimum and maximum values, excluding outliers. Comparisons were made with two-sided Wilcoxon test (P < 0.01 was considered significant). Source data are provided as a Source Data file.

