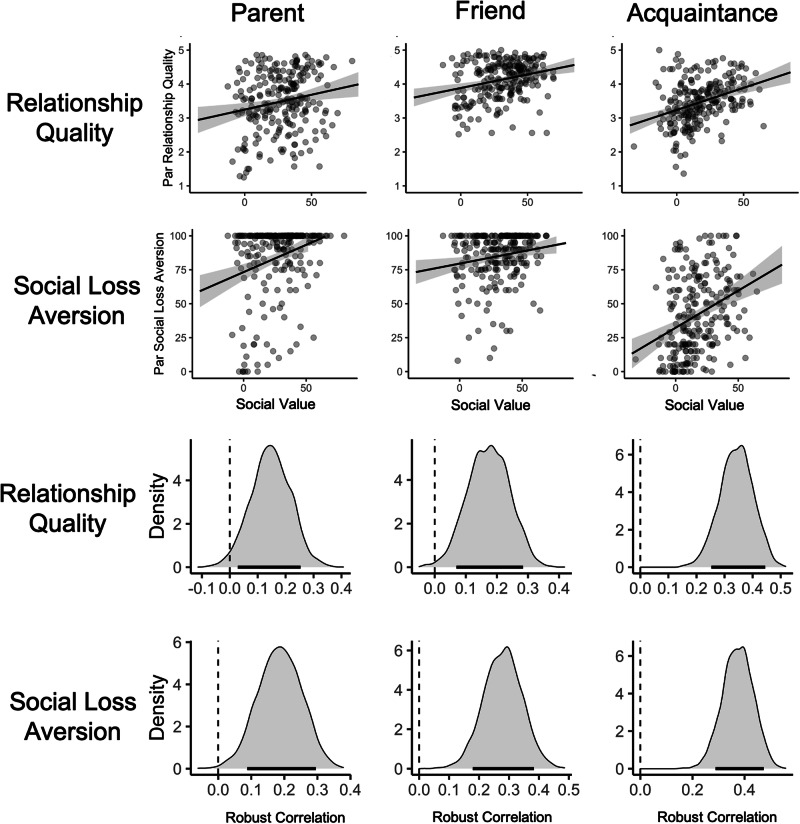
Fig. 2. Social value scores are correlated with relationship quality and social loss aversion.
Data for this visualization were drawn from confirmatory phase (prolific sample, SONA-sourced weights). The top set of scatter plots visualizes relationship between social value scores and outcome variables for a given social partner. Pearson correlations are visualized with the trend lines in the top set of plots. The bottom set of plots depicts the posterior distributions for each correlation (the likelihood of observing a given correlation value given the data). Posterior distributions were obtained via MCMC sampling. The black bars underlying each posterior distributions represents the 89% highest density credible interval (HDI). A hashed vertical line is shown over zero (null value). Evidence was judged to be robust if the HDI did not include 0 or the HDI fell outside of the Region of Practical Equivalence (ROPE) and moderate if part of the HDI fell outside of ROPE (see “Inferential Criteria” section of the main text). ROPE was defined as the range between −0.1 and 0.1. Here, there was robust evidence for an association between social value scores and relationship quality for all three social partners. There was also robust evidence for an association between social value scores and social loss aversion for all three social partners. The sample size for this analysis is N = 233.

