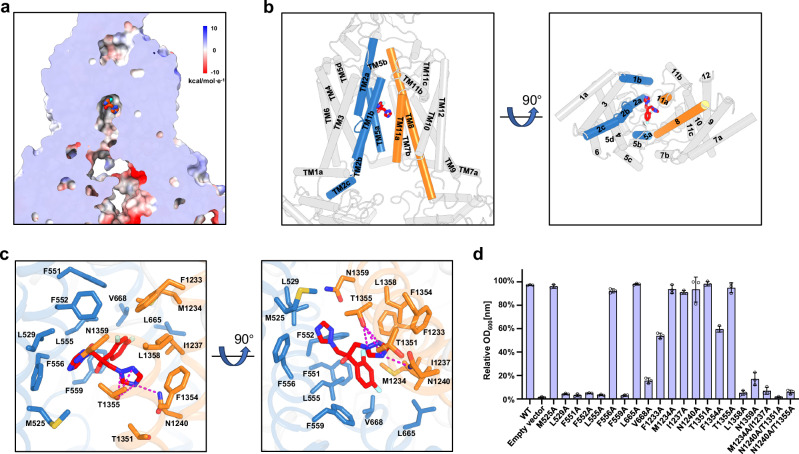
Fig. 2. Fluconazole recognition by TMDs of Cdr1.
a Sectional view displaying the electrostatic surface of Cdr1Flu. Red-colored fluconazole resides at the top of the hydrophobic central cavity. b Side (left figure) and bottom (right figure) views of Cdr1Flu. Fluconazole is surrounded by TM1b, TM2a and TM5a from TMD1(sky-blue), TM8 and TM11a from TMD2 (orange). c Coordination of fluconazole by TMDs of Cdr1Flu. Residues from TMD1 are colored by sky-blue, while those from TMD2 are colored by orange. Magenta dashes indicate hydrogen bonds. d Relative OD600nm values for wild type and mutants under a 10 µg/mL fluconazole concentration. The y-axis represents the relative OD600nm values as a percentage of the control (no drug). Three independent experiments were conducted for both wild type and mutants. Data are presented as mean values ± SD; n = 3 independent experiments.

