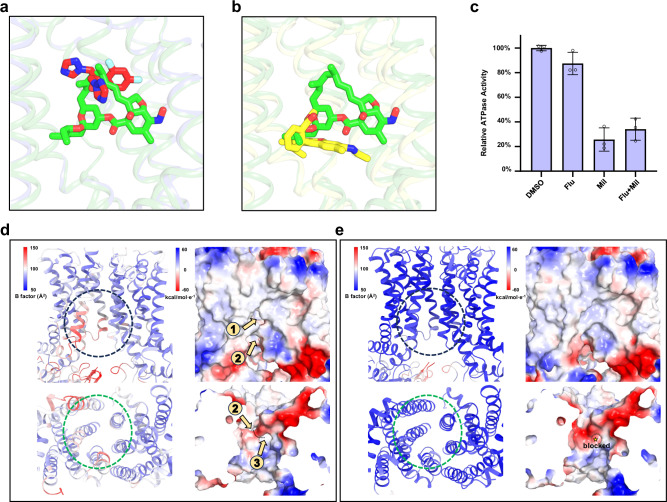
Fig. 5. Inhibitory mechanism of milbemycin oxime.
a Overlapped binding poses of milbemycin oxime and fluconazole. Steric clash explains their competition for binding to Cdr1. Fluconazole, and milbemycin oxime are colored by red and green, respectively. b Overlapped binding poses of milbemycin oxime in Cdr1Mil and R6G in Pdr5R6G (PDB: 7P05). Steric clash explains their competition for binding to Cdr1. Milbemycin oxime and R6G are colored by green and yellow, respectively. c Relative ATPase activity of wild type Cdr1 by adding DMSO, fluconazole (Flu), milbemycin oxime (Mil) or fluconazole with milbemycin oxime (Flu+Mil). The concentrations of fluconazole and/or milbemycin oxime were ten times greater than that of the purified Cdr1. These drugs are dissolved in DMSO. Data are presented as mean values ± SD; n = 3 independent experiments. Stability analysis of the cytoplasmic and inner-leaflet entrances of Cdr1Flu (d) and Cdr1Mil (e). The left panels in both figures are shown by B-factor analysis. Higher B-factors are depicted in red, indicating greater flexibility, while lower B-factors are shown in blue, signifying rigidity. The electrostatic potential is color-coded in the right panels, ranging from red (indicating negative charge) to blue (indicating positive charge). The dashed circle marks the cytoplasmic (black) and inner-leaflet (green) entrances in the panels. The orange arrows indicate the substrate entrance channel.

