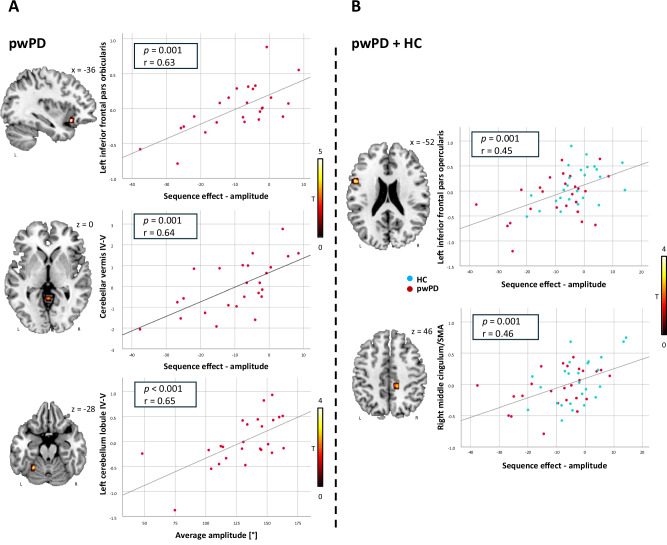
Fig. 3. Correlation between fMRI and kinematic data obtained during the right hand-tapping task.
Correlations in pwPD (A) and in pwPD and healthy controls together (B). All findings are shown at p < 0.001 uncorrected (5000 permutations). Colour bars denote T value. Results are shown on axial, sagittal and coronal sections (z, x or y MNI coordinates are reported) of the Montreal Neurological Institute standard template. r and p refer to Spearman’s correlation coefficient. fMRI functional Magnetic Resonance Imaging, HC healthy controls, L left, pwPD people with Parkinson’s Disease, R right.

