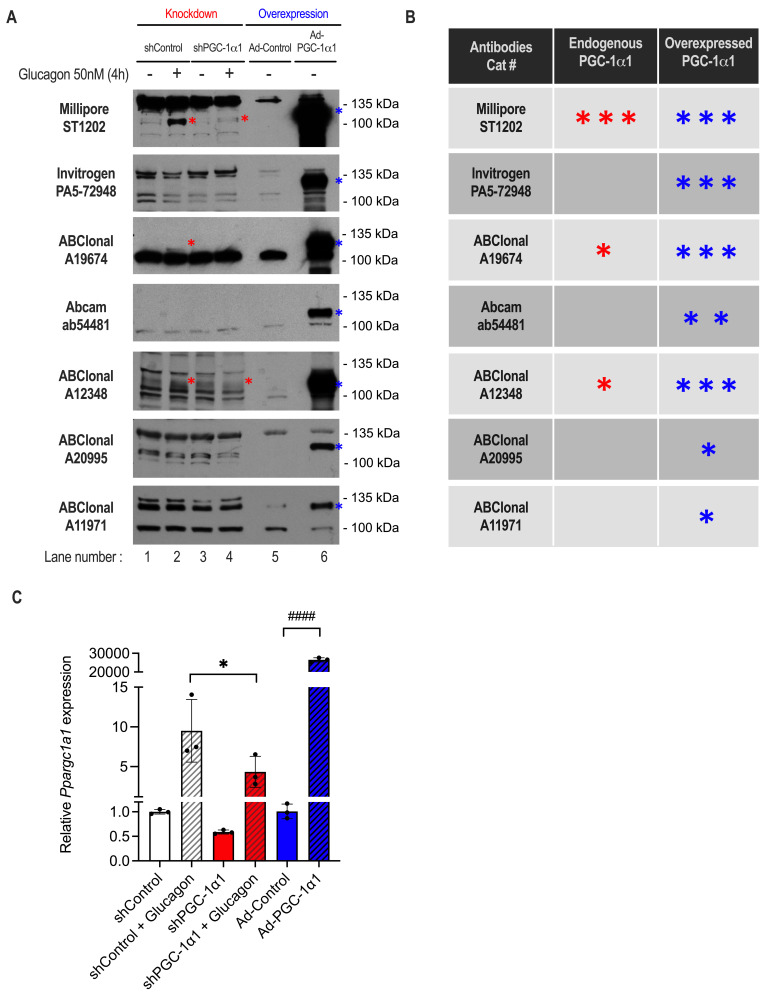
Figure 1. Comparison of PGC-1α antibody sensitivity and specificity for endogenous and overexpressed mouse PGC-1α1 protein by Western blot .
(A) Seven antibodies were tested on protein lysates from primary mouse hepatocytes following PGC-1α1 knockdown using shRNA (shPGC-1α1) or overexpression (Ad-PGC-1α1) using adenoviral vectors. Cells expressing shPGC-1α1 or a control shRNA (shControl) were treated with or without 50 nM glucagon for 4 hours to increase endogenous expression. As a positive control, mouse PGC-1α1 was overexpressed (Ad-PGC-1α1) and compared to vector alone (Ad-Control). For each blot, a red star is placed beside the band representing endogenous PGC-1α1 and a blue star beside overexpressed PGC-1α1. Unlabeled bands are either non-specific or other PGC-1α isoforms. (B) Comparison table of PGC-1α antibodies. Red and blue stars indicate whether the antibody recognizes endogenous and/or overexpressed PGC-1α1, respectively. Based on qualitative analysis of similarly exposed Western blot films, more stars mean greater sensitivity. (C) mRNA transcript levels of mouse Ppargc1a1 in a separate experiment where primary hepatocytes were treated as in (A). Data are mean±SD of biological replicates from one representative experiment of three independent trials. Statistical analysis was performed using a one-way ANOVA between shControl and shPGC-1α1 or shControl + glucagon and shPGC-1α1 + glucagon [p ≤ 0.05 (*)]. An unpaired t-test was performed between Ad-Control and Ad-PGC-1α1 [p ≤ 0.0001 (####)].

