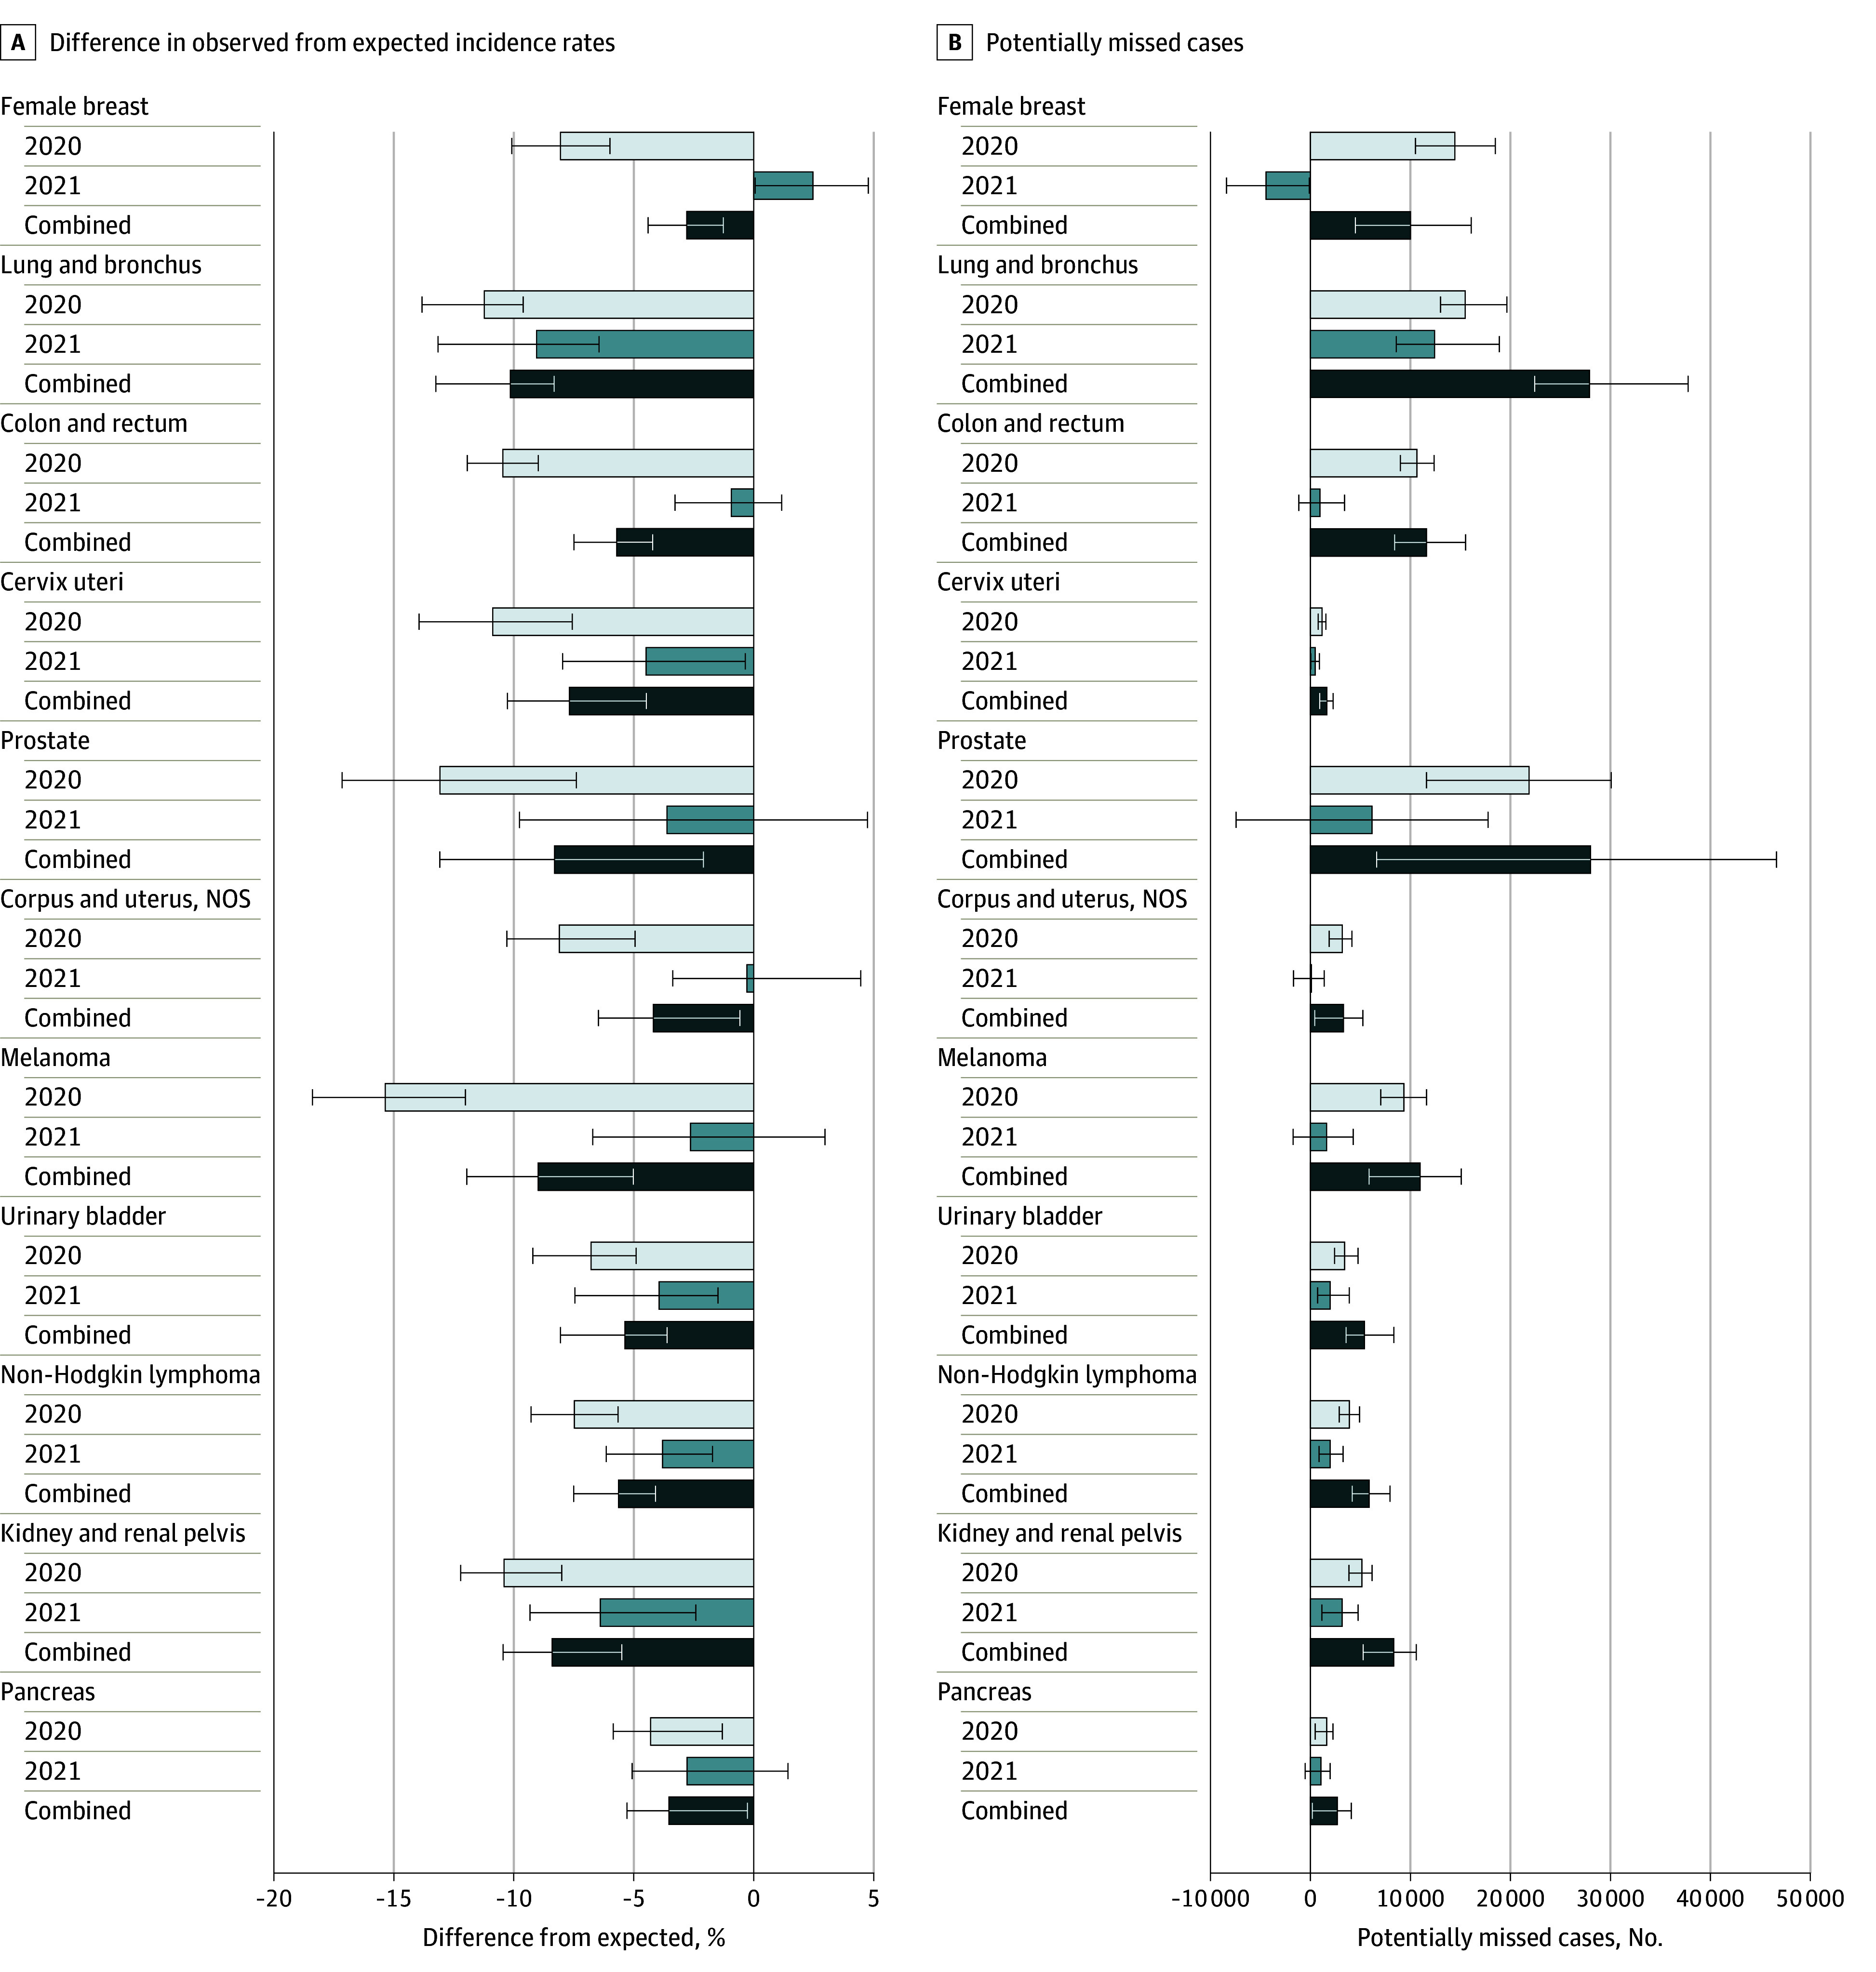
Figure 2. Percentage Difference in Observed From Expected Incidence Rates and Potentially Missed Cases, by Site and Period, January 2020 to December 2021.

Error bars indicate the 95% prediction intervals. NOS indicates not otherwise specified.

Error bars indicate the 95% prediction intervals. NOS indicates not otherwise specified.