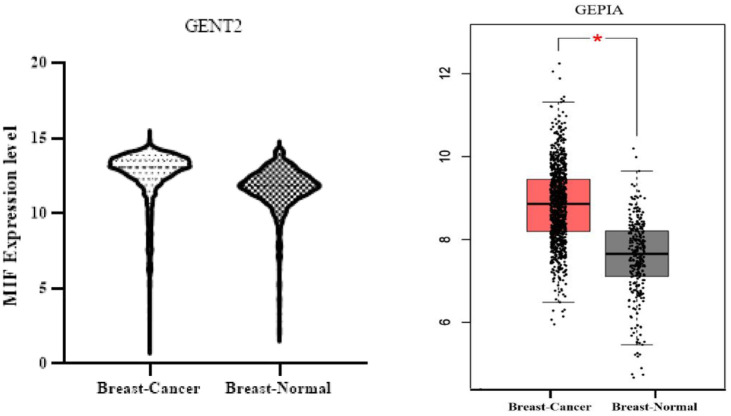
Figure 2.
Overexpression of MIF using GENT2 and GEPIA databases. From the GENT2 database with the address http://gent2.appex.kr/gent2/, the level of MIF gene expression in 5574 cancer samples and 475 normal samples was obtained and the related graph was drawn using GraphPad Prism program. Then, using the GEPIA database with the address http://gepia.cancer-pku.cn/detail.php?gene=mif and the expression DIY section, the MIF gene expression level was obtained based on Box Plots by comparing 1085 cancer samples and 291 normal samples. Both databases showed increased MIF gene expression. MIF indicates migration inhibitory factor.

