Figure 7.
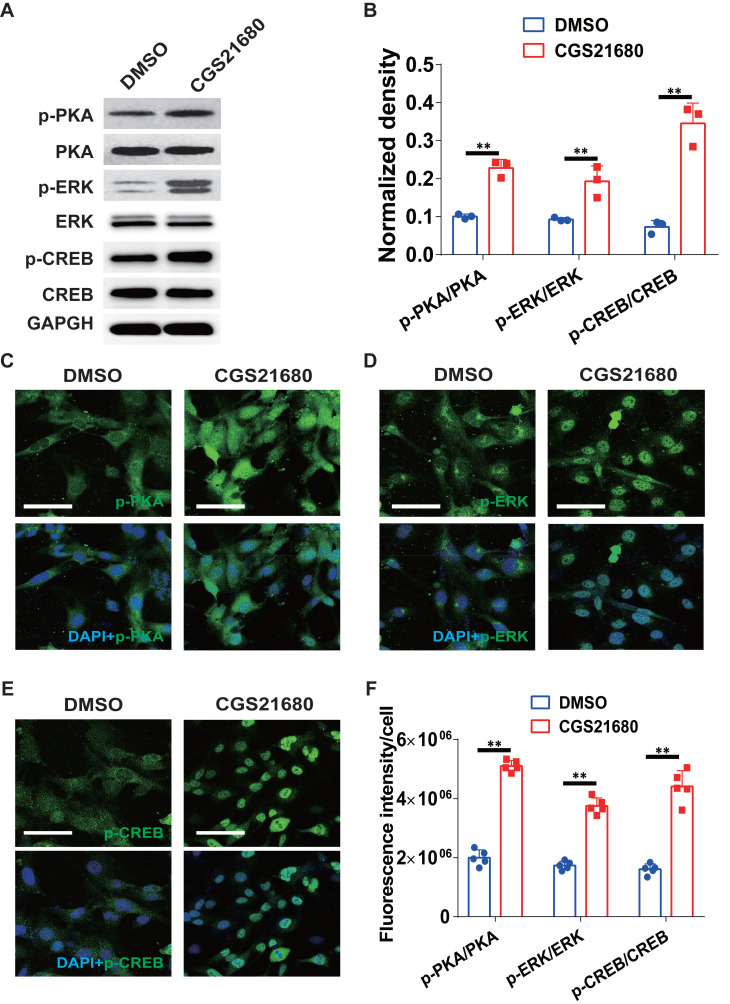
Changes in the ERK/CREB signaling pathways after A2AR activation in HMECs. (A) Representative immunoblot images of the levels of PKA, p-PKA, ERK, p-ERK, CREB and p-CREB in HMECs 24 h after treatment with CGS21680. (B) Quantitative analysis of (A). **p < 0.01 (n=3); Immunohistochemistry for p-PKA (C), p-ERK (D) and p-CREB (E) in HMECs 24 h after treatment with CGS21680. Scale bar, 50 µm. (F) Quantitative analysis of (C-E). **p < 0.01, *p <0.05 (n=5).

