Figure 3.
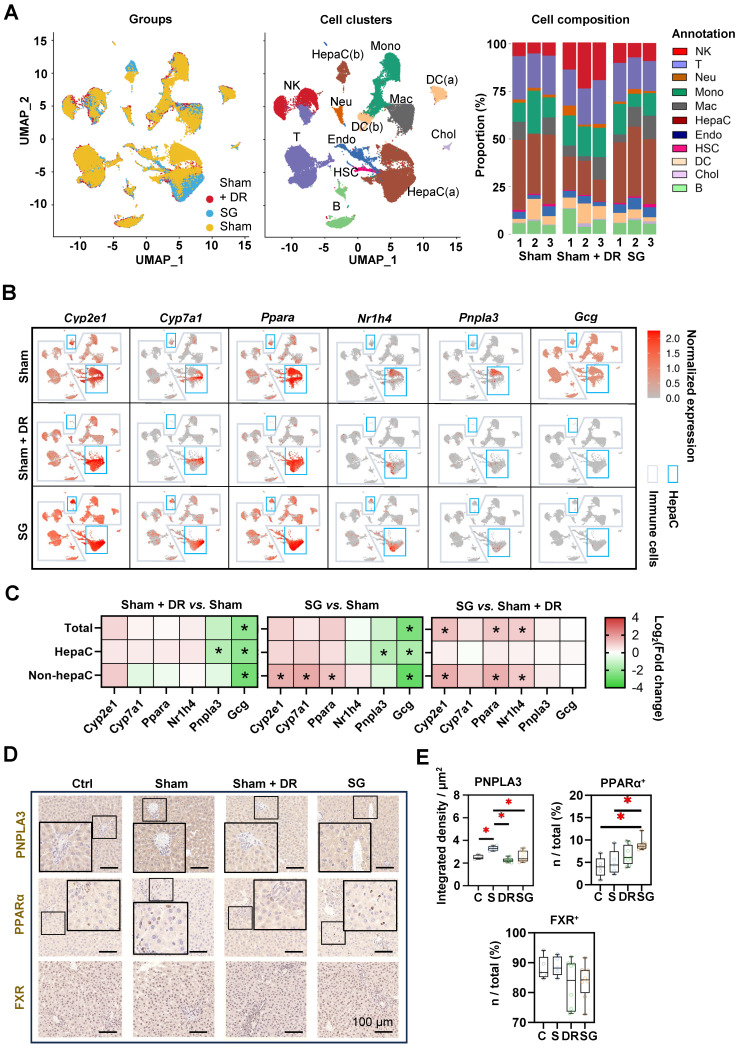
Sleeve gastrectomy improves hepatic metabolism according to sc/sn-transcriptome analysis and in-situ exploration. (A) UMAPs describe the distribution of B cells, cholangiocytes, DCs, endothelial cells, hepatic stellate cells, hepatocytes, macrophages, monocytes, neutrophils, T cells and NK cells. Histograms describing cell proportions. (B) Gene expressions of Cyp2e1, Cyp7a1, Ppara, Nr1h4, Pnpla3 and Gcg were illustrated on rat liver cells upon Sham, Sham + DR and SG. (C) Gene expression changes of Cyp2e1, Cyp7a1, Ppara, Nr1h4, Pnpla3 and Gcg were illustrated on rat liver cells upon Sham, Sham + DR and SG. Protein levels of PNPLA3, PPARα and FXR were illustrated (D) and quantified (E) on rat liver tissue of Ctrl, Sham, Sham + DR and SG groups. Abbreviations: Ctrl: control fed a normal diet; Sham: sham surgery; DR: dietary restriction; SG: sleeve gastrectomy; PPAR: peroxisome proliferator-activated receptor; PNPLA: patatin-like phospholipase domain-containing protein; FXR: farnesoid X receptor; CK: cytokeratin; IL: interleukin; DC: dendritic cells; NK: natural killer cells; B: B lymphocytes; T: T lymphocytes; Neu: neutrophils; Mac: macrophages; Mono: monocytes; Endo: endothelial cells; HSC: hepatic stellate cells; Chol: cholangiocytes; HepaC: hepatocytes. The one-way ANOVA test followed by Tukey's multiple comparisons was performed. '*' represents 'p < 0.05' and statistical significance.

