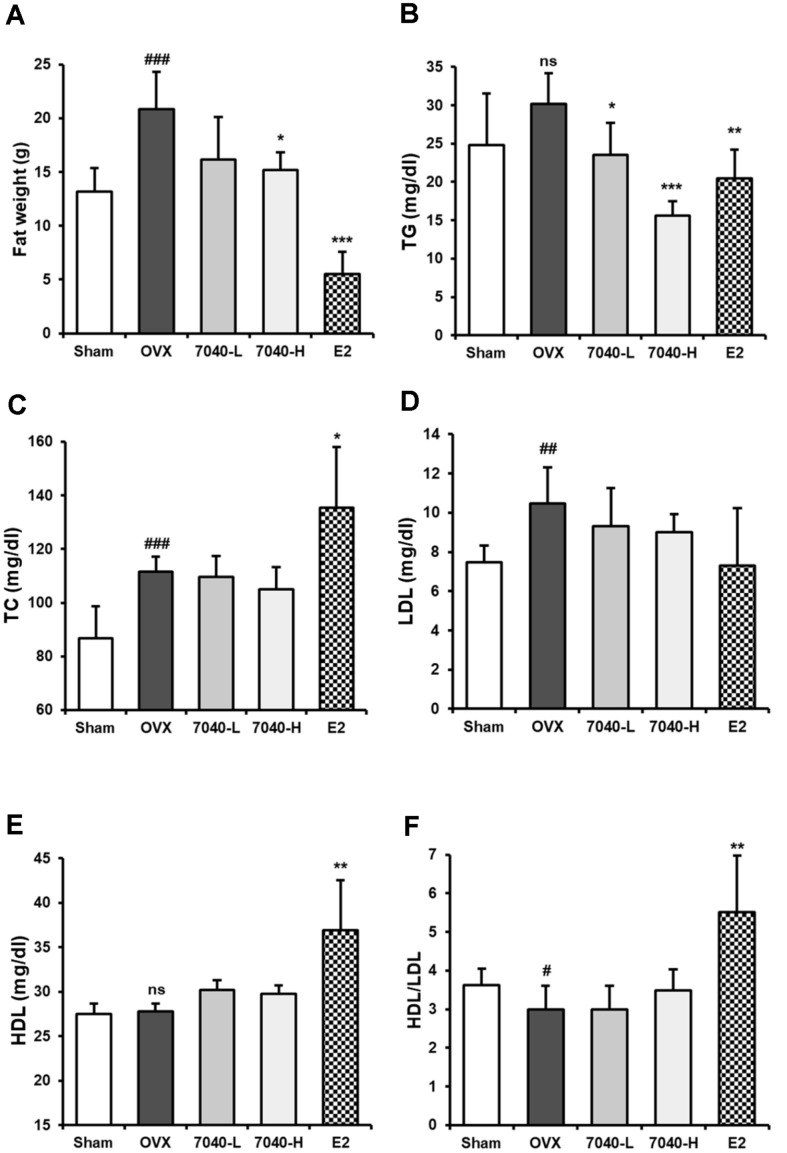
Fig. 4. Effect of HDB7040 on the fat weight and blood concentrations of lipid metabolism biomarkers in OVX rats.
After sacrifice, (A) visceral adipose tissues were weighed, and (B) blood TG, (C) TC, (D) LDL, and (E) HDL concentrations were measured using ELISA kits. (F) HDL/LDL ratio was also calculated by dividing HDL concentrations by LDL concentrations. Data are presented as the mean ± SD (n = 8). ##, p < 0.01; ###, p < 0.001, compared to the Sham group; *, p < 0.05; **, p < 0.01; ***, p < 0.001, compared to the OVX group.

