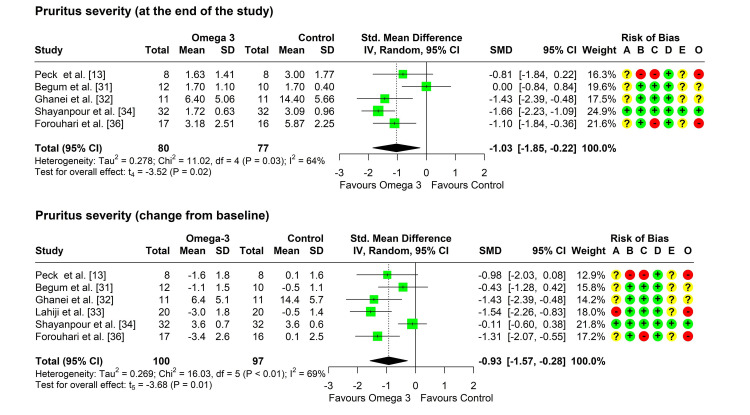
Figure 2. Forest plot showing pooling of the studies’ findings regarding the pruritus severity at the end of treatment and change from baseline.
CI: confidence interval; SD: standard deviation; SMD: standardized mean difference; A: randomization process; B: deviations from intended interventions; C: missing outcome data; D: measurement of the outcome; E: selection of the reported result; O: overall risk of bias

