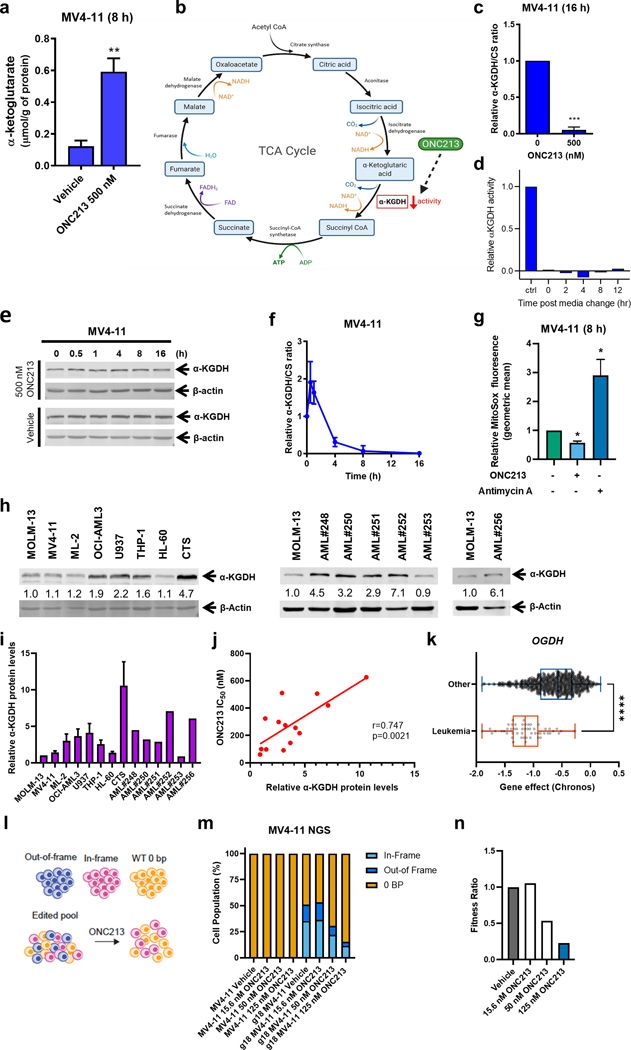
Fig. 4. ONC213 treatment suppresses α-KGDH activity.
a. MV4–11 cells were treated with vehicle or ONC213 for 8 h. Cells were collected, washed with PBS, and cell pellets were stored at −80 °C. Metabolites were quantitatively profiled using LC-MS/MS-based targeted metabolomics platform at the Karmanos Cancer Institute Pharmacology Core. Data were analyzed using www.MetaboAnalyst.ca, version 4.0. α-ketoglutarate is graphed as mean ± SEM. ** P<0.01. b. TCA cycle diagram (created with BioRender.com). c. MV4–11 cells were treated with vehicle or ONC213 for 16 h. α-ketoglutarate dehydrogenase (α-KGDH) activity was measured. The ratio of α-KGDH activity to CS activity was determined and normalized to the vehicle control. *** P<0.001 compared to control. d. MV4–11 cells were treated with vehicle or 500 nM ONC213 for 16 h. The cells were resuspended in drug-free medium and α-KGDH activity was measured at 0–12 h post media change. e. Whole cell lysates from MV4–11 cells were treated with vehicle or ONC213 for up to 16 h were analyzed by western blot. Representative western blots are shown. f. α-KGDH activity to CS activity was determined in MV4–11 cells were treated with vehicle or 500 nM ONC213 for various intervals up to 16 h. g. MV4–11 cells were treated with either vehicle or 250 nM ONC213 for 8 h. MV4–11 cells were treated with the Complex III inhibitor antimycin A (50 uM, 15 minutes before MitoSox addition) as a positive control for mitochondrial ROS induction. Cells were stained with 5 uM MitoSox for 30 minutes. Samples were collected, washed with PBS, and flow cytometry was used to measure MitoSox fluorescence. Geometric mean was calculated using FlowJo version 10.8.1. Relative MitoSox fluorescence was determined with respect to the vehicle treated group. ONC213 decreased superoxide production. * P<0.05 h-j. Whole cell lysates from AML cell lines and primary patient samples were analyzed by western blot. Representative western blots are shown. The fold changes for the densitometry measurements, normalized to β-actin and then compared to MOLM-13, are indicated. Normalized densitometry measurements are shown in panel i (cell line data was generated from three independent experiments, while primary patient samples were from one experiment due to limited sample). Relative α-KGDH protein levels were graphed against ONC213 IC50s in panel j. The relationship between protein levels and IC50s was determined by nonparametric Spearman rank correlation coefficient. k. Chronos scores from the OGDH dependency data derived from the Public 22Q4 dataset were plotted for leukemia and other cancer cell lines. l-n. MV4–11 cells were transfected with gRNA specific to OGDH and the gene editing was confirmed by next generation sequencing. The cells were then treated with the indicated concentration of ONC213 for 72 h and harvested. Genomic DNA was harvested and sequenced to determine the extent of gene editing in the cells that survived. In the pooled cells, there are three groups of cells: out-of-frame deletion resulting in a loss of functional gene, in-frame-deletion that may not result in a loss of function, and a 0-bp deletion representing WT cells. There was a specific fitness defect after ONC213 treatment for MV4–11 cells with out-of-frame deletion in OGDH gene. A fitness ratio was calculated by dividing the percentage of out-of-frame indels in ONC213 treated groups by the percentage of out-of-frame indels in the vehicle treated sample. The dose-dependent decrease in fitness ratio further indicates a fitness defect in MV4–11 cells lacking functional OGDH.

