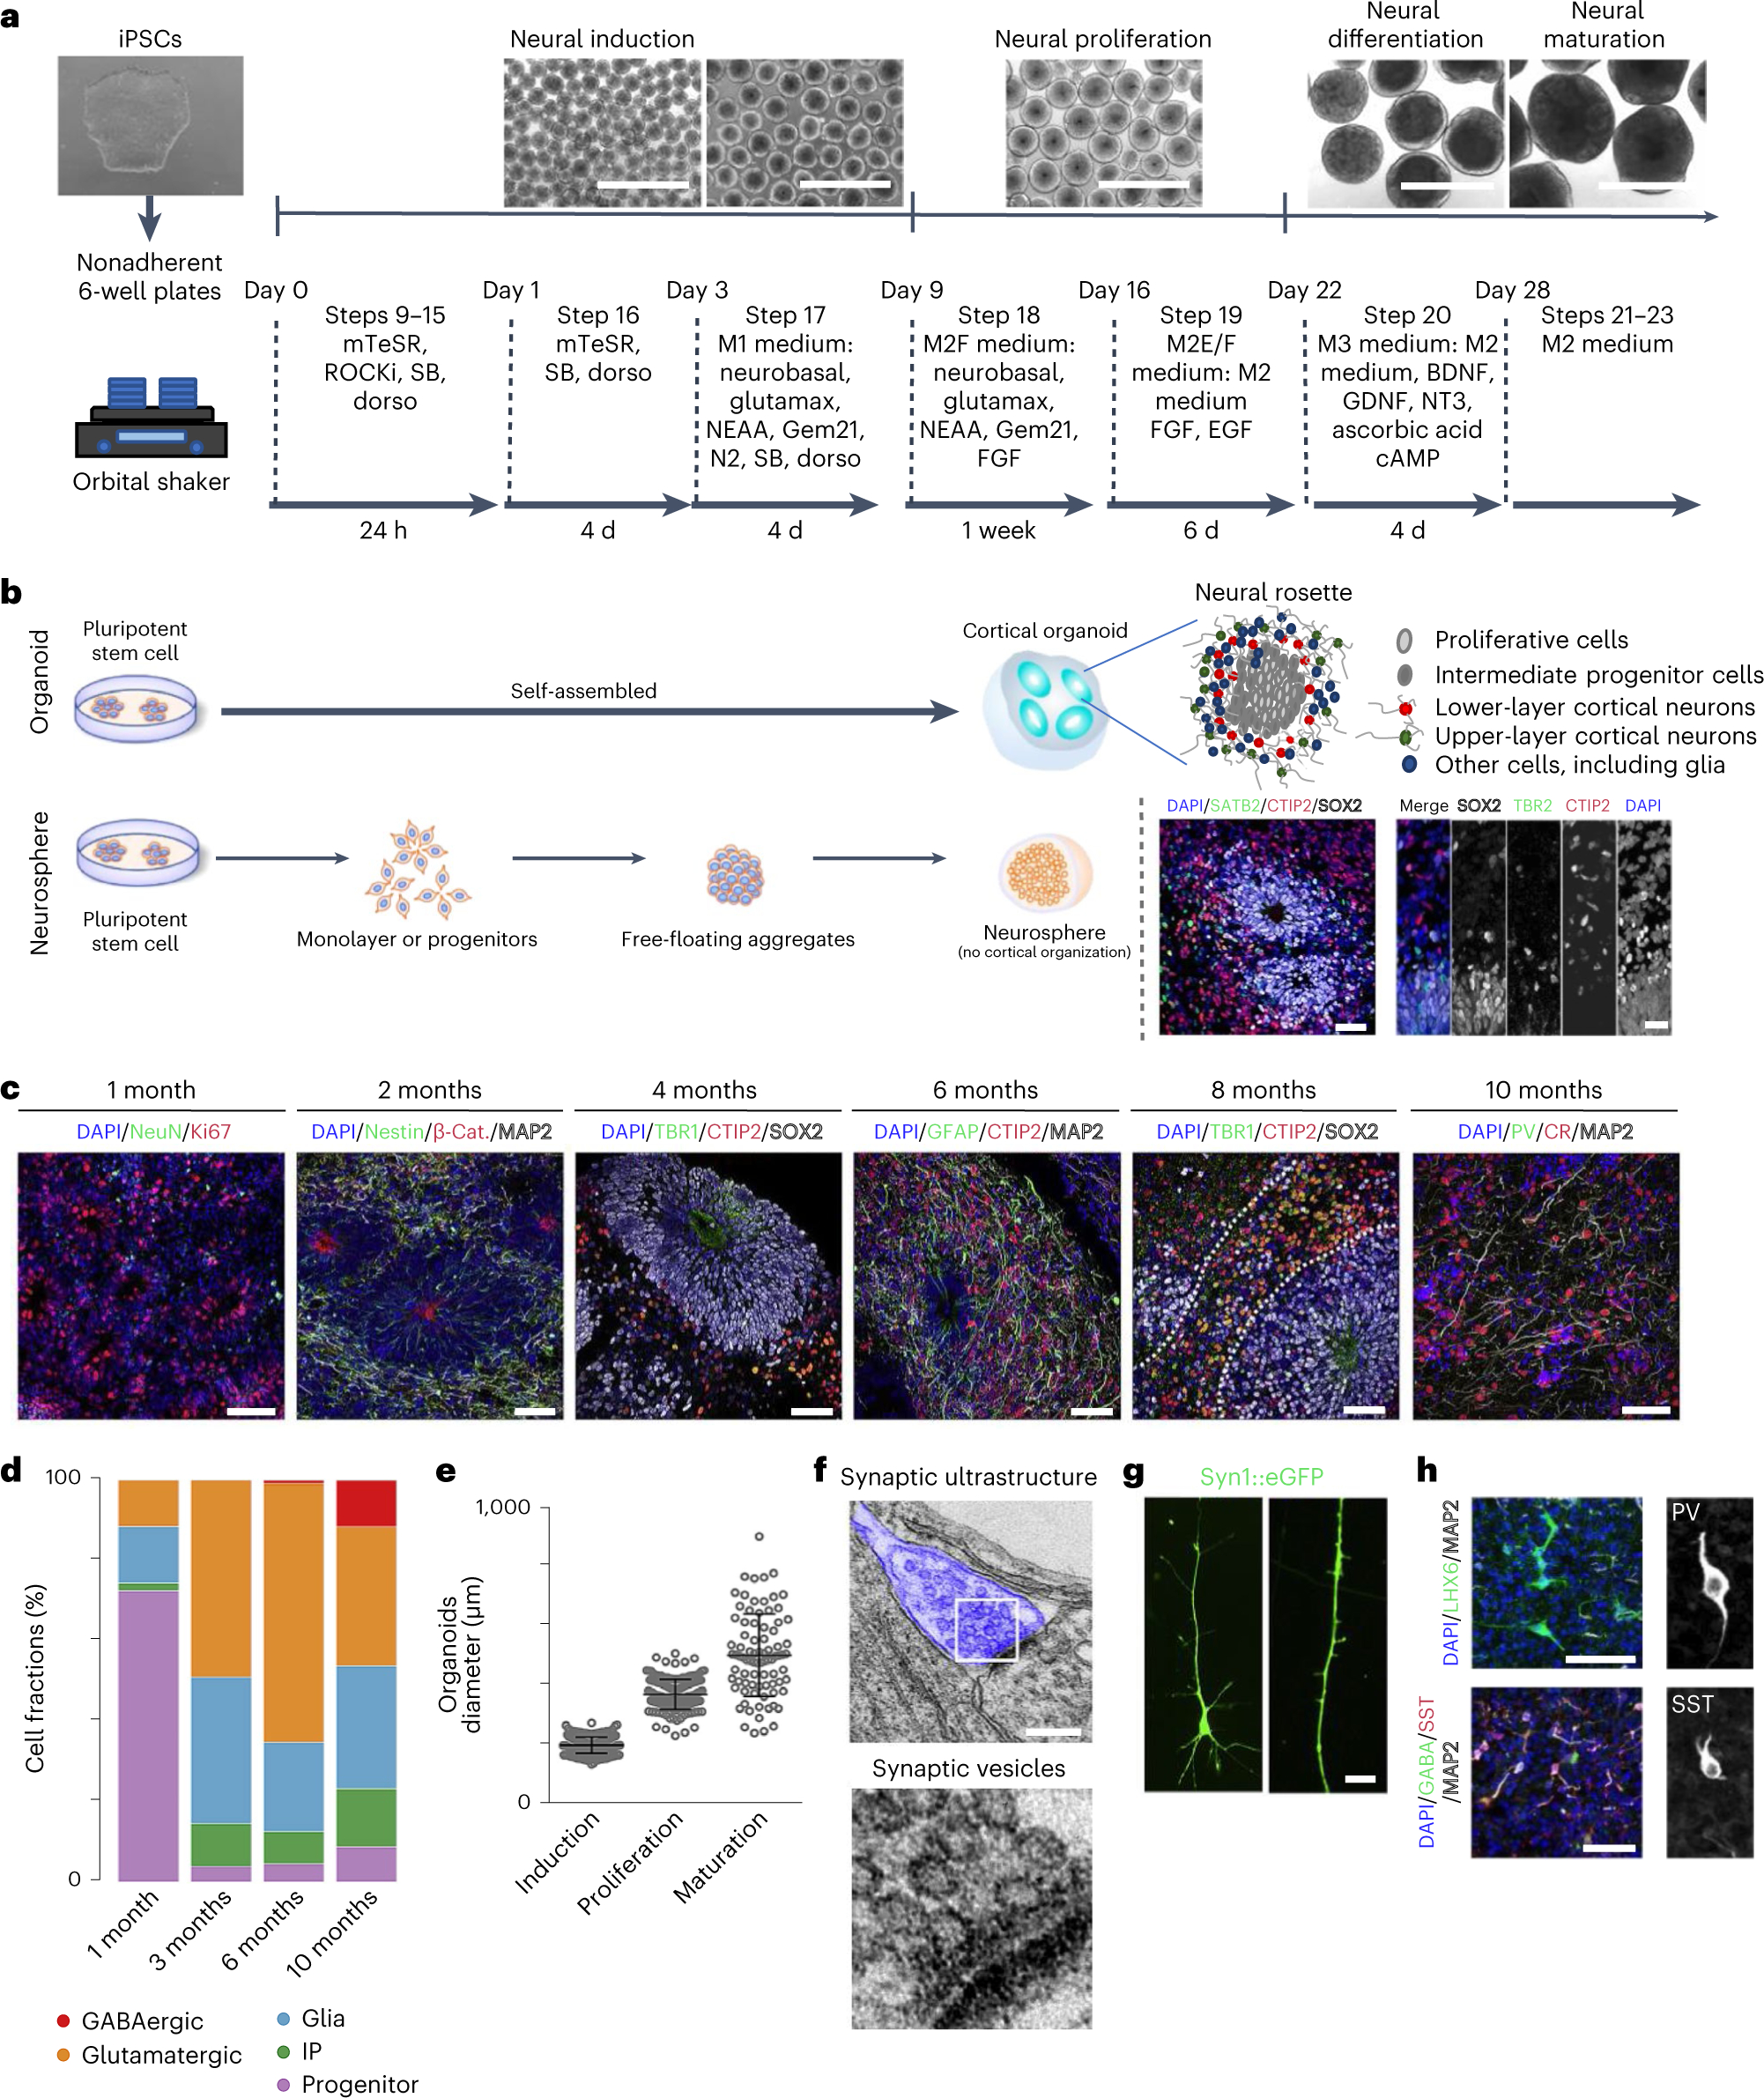
Fig. 1 |. Overview of generation of cortical organoids and resulting features.

a, A schematic of the protocol used to generate cortical organoids. Scale bars, 1 cm. b, A schematic comparison of brain organoids versus neurosphere, with graphics of neural rosettes and representative immunostainings showing proliferative cells (SOX2), intermediate progenitor cells (TBR2) and lower layer (CTIP2) and upper layer (SATB2) cortical neurons. Scale bars, 50 μm. c, Representative immunostainings that show nuclei (DAPI), β-catenin ((β-cat) stabilized in inner lumen of rosette), proliferating neural progenitor cells (NPCs) (Ki67 and Nestin), neurons (NeuN), lower cortical layer neurons (TBR1 and CTIP2), upper cortical layer neurons (SATB2), interneurons (CR) and glial cells (GFAP), over time. Scale bars, 50 μm. d, The proportion of progenitor cells, intermediate progenitor (IP) cells, glia, and glutamatergic and GABAergic neurons from scRNAseq (~12,000 cells per library prep) at individual timepoints represented as a bar plot. e, The expected organoid size over the course of development, ~200 μm during induction, 375 μm during proliferation and 500 μm during maturation. Induction is around day 5, proliferation is around day 18, maturation is around day 28. f, Electron microscopy of synaptic ultrastructure (blue), staining from a 4-month-old organoid. Scale bar, 200 nm. g, A representative image of a pyramidal neuron and dendritic structures, observed in 4-month-old neurons using a SYN:EGFP reporter. Scale bar, 5 μm. h, Immunostaining of 10-month cortical organoids for the GABAergic neuronal markers parvalbumin (PV) and somatostatin (SST). Scale bars, 50 μm. Panels b–h adapted with permission from ref. 7, Elsevier.
