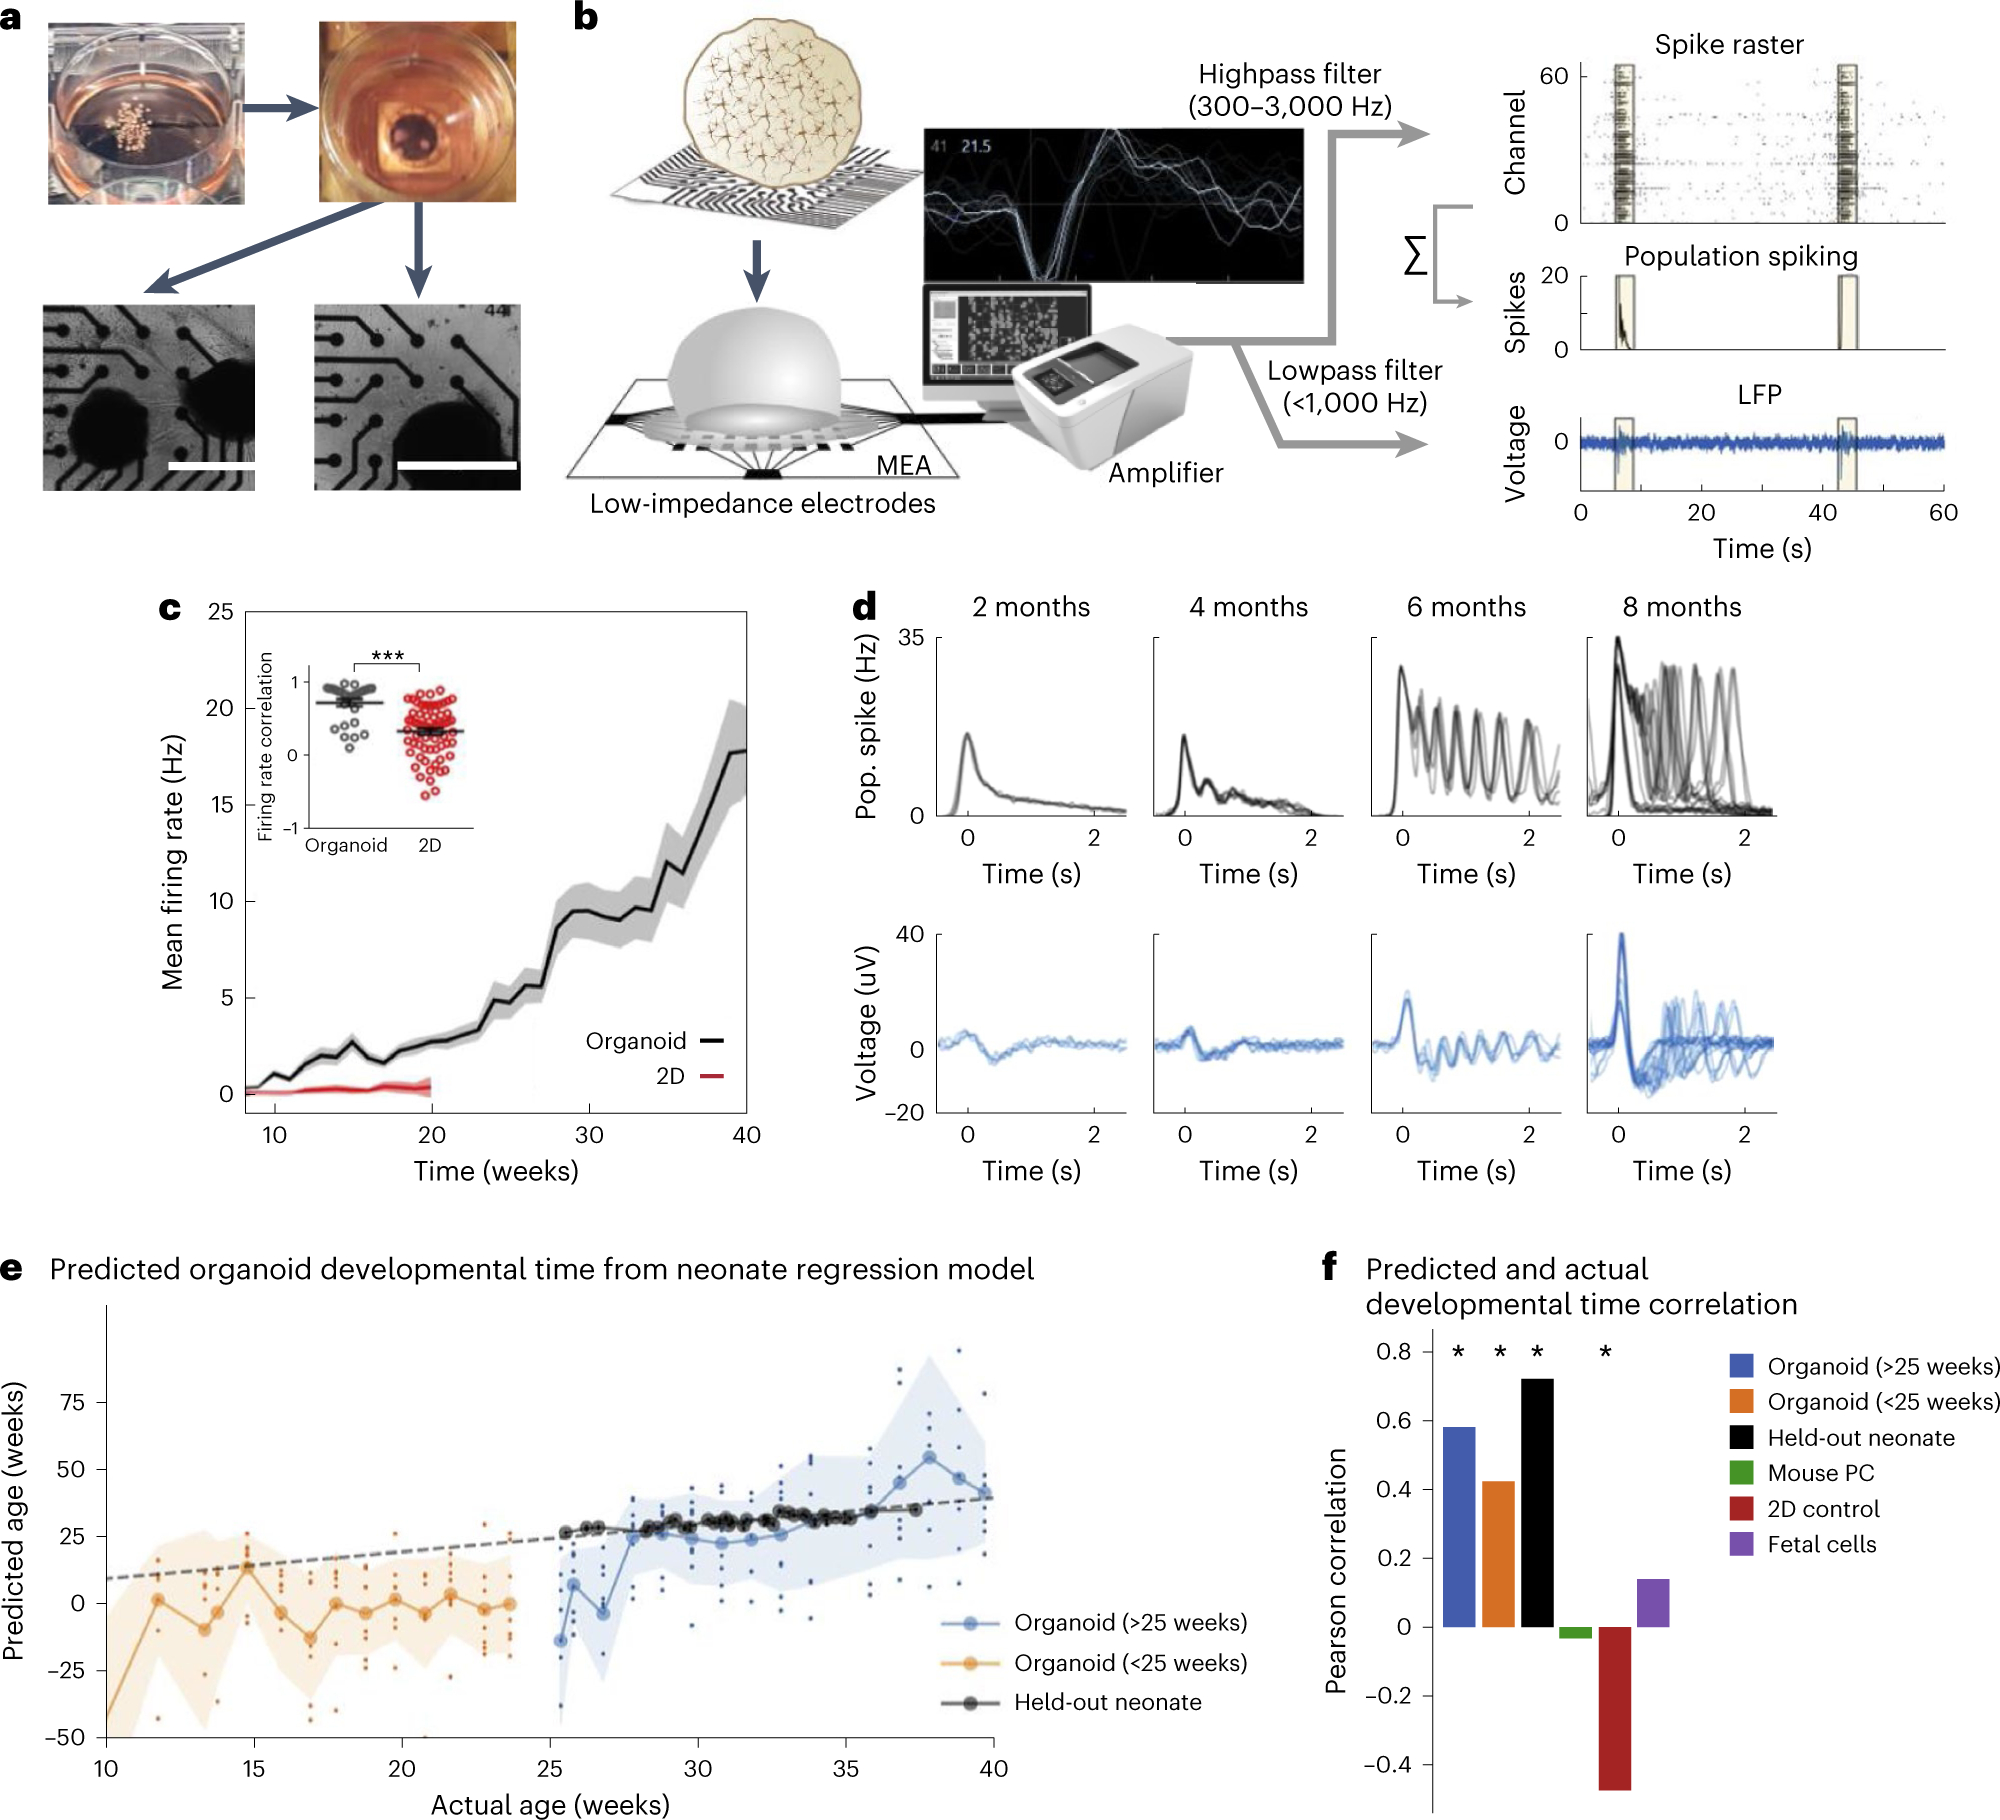
Fig. 2 |. Electrophysiology overview and characterization.

a, Pictures depicting plating of organoids on an MEA plate. Scale bars, 1 mm. b, A schematic for the electrophysiological signal processing pipeline in organoids. Representative waveform shape of neuronal trace/spike. Raw MEA data are analyzed as population spiking and LFP separately. Yellow highlights indicate synchronous network events. c, Compared with 2D neurons, cortical organoids show elevated and continuously increasing mean firing rate (n = 8 for organoid cultures and n = 12 for 2D neurons ± s.d.). Inset: correlation of the firing rate vector over 12 weeks of differentiation (from 8 to 20) between pairs of cultures showing reduced variability among organoid replicates ± s.d. d, A time series of LFP and population (pop.) spiking during network events in cortical organoid development. Each overlaid trace represents a single event during the same recording session. e, Developmental time as predicted by the model (y axis, age in weeks) follows actual weeks that the organoids (orange and blue) were in culture (x axis), as well as the true age of heldout preterm neonate data points in black. The dashed line represents unity and signifies a perfect prediction. Large circles on solid lines and shaded regions denote mean ± s.d. of prediction, respectively, and dots indicate prediction per sample (n = 8 for organoids at all timepoints). f, Pearson’s correlation coefficient between actual and predicted developmental time for organoid and control datasets, including held-out preterm neonate data, mouse primary culture (PC), 2D iPSC culture, and human fetal brain culture. Positive correlations indicate the model’s ability to capture developmental trajectory. Panels b–f adapted with permission from ref. 7, Elsevier.
