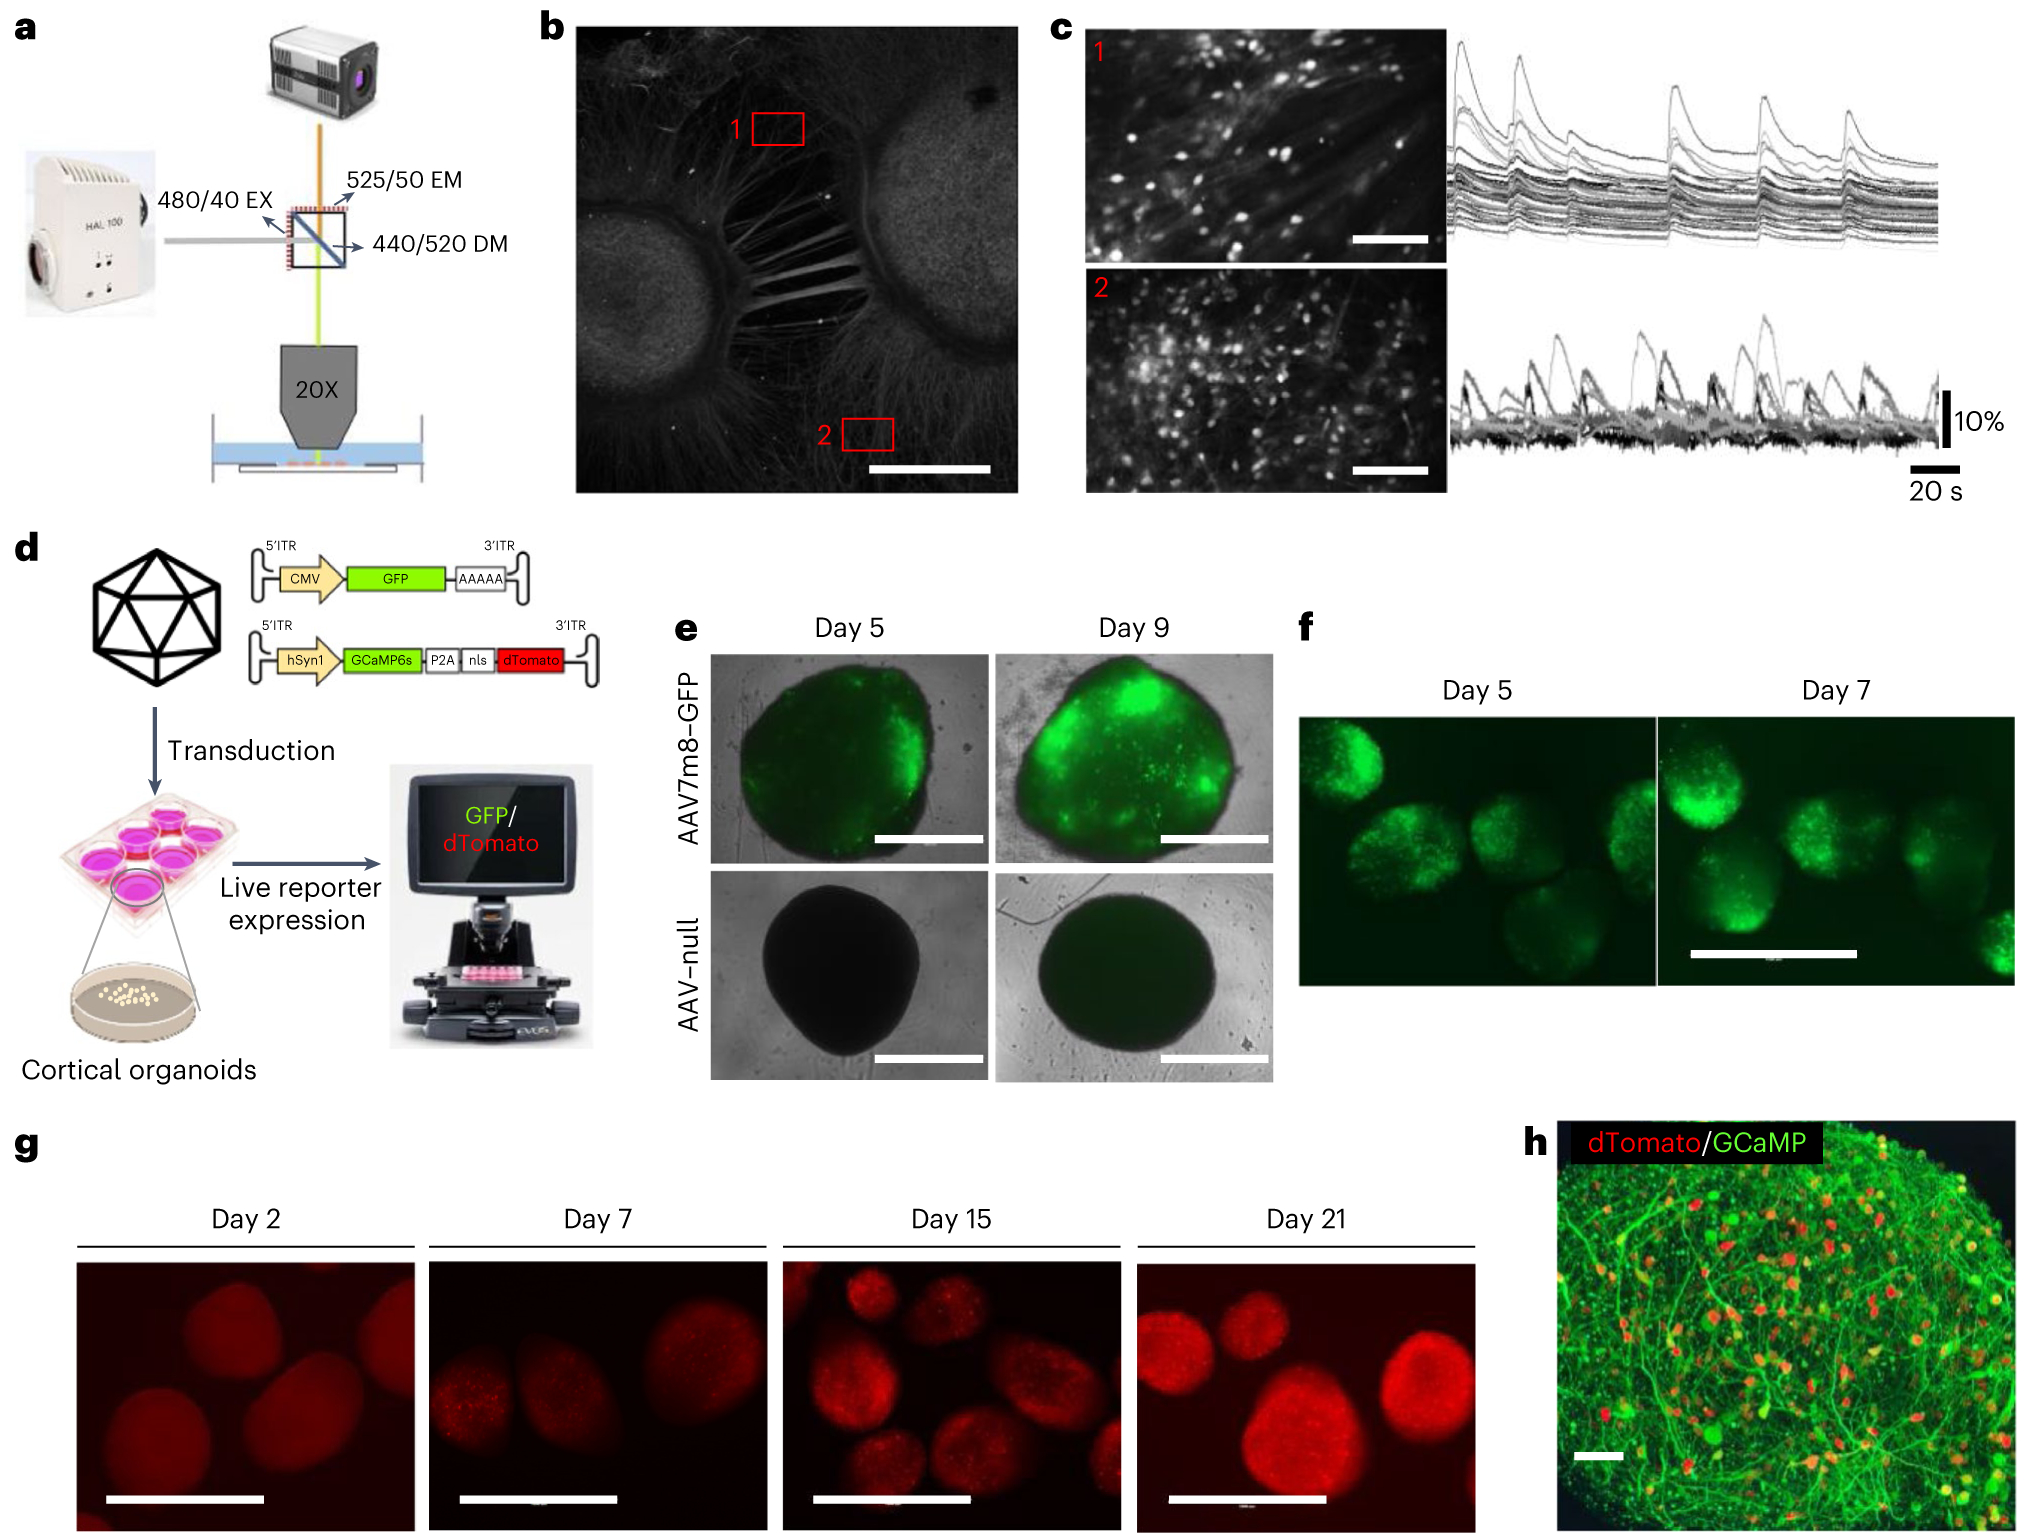
Fig. 3 |. Calcium imaging overview and AAV7m8–GCaMP transduction characterization in cortical organoids.

a, The optical setup for one-photon calcium imaging in organoids plated onto imaging plates, with example excitation (EX), emission (EM) and dichroic mirror (DM) specifications. b, A representative image of MAP2-stained cortical organoids and their interconnecting networks on imaging plates. Scale bar, 1,000 μm. c, Calcium traces recorded in two representative FOVs showing highly synchronized calcium activity alternating to individual spiking. Scale bars, 250 μm. d, Experimental design for the transduction of cortical organoids with AAV7m8 and example GFP and GCaMP inverted terminal repeat (ITR) sequence vectors. CMV, cytomegalovirus. e, Representative images of isolated cortical organoids transduced with AAV7m8–GFP and AAV–null at 1 × 10¹⁰ vg per well in a 96-well plate on days 5 and 9 after transduction, respectively. Scale bars, 1,000 μm. Replicates: AAV–null = 2, AAV7m8–GFP = 4. f, Representative images of cortical organoids transduced with AAV7m8–GFP at 1 × 10¹⁰ vg per well in a 6-well plate on days 5 and 9 after transduction, respectively. Scale bar, 1,000 μm. g, Representative images of cortical organoids showing neuronal expression of GCaMP sensor on days 2, 7, 15 and 21 after transduction, respectively. Scale bars, 1,000 μm. h, Representative confocal image of a 2-month-old organoid expressing GCaMP sensor (green) with physically separate nuclear localized dTomato fluorophore (red). Scale bar, 50 μm.
