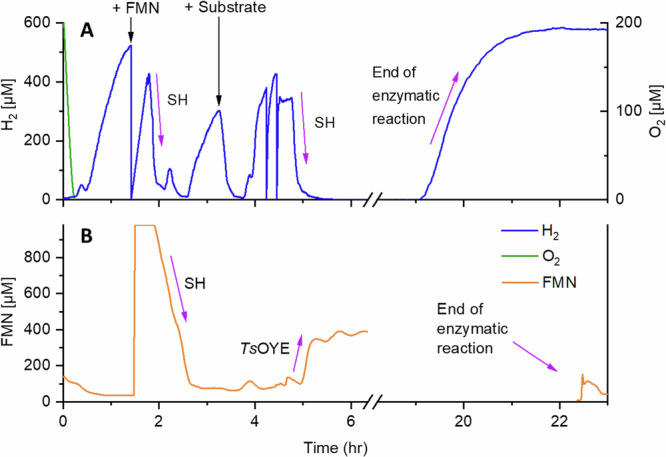
Fig. 2. On-line monitoring of H2, O2, and FMN during the electro-driven biotransformation.

The concentration of H2 (A, blue), O2 (A, green), and oxidized FMN (B, orange) were followed during 24 h of the transformation of 3 to 4 as exemplary biotransformation. H2 was supplied to the system with the rate of 11 mL min−1 by the PEM electrolyzer (3.4 V, 0.89 A) and gas addition module. The electrolysis was performed until H2 concentration reached a plateau and then FMN was added (black arrow). After H2 concentration started to increase again and FMN was fully reduced to FMNH2, substrate was added to ensure reducing conditions for TsOYE activity. Purple arrows indicate the activity of each enzyme: the activity of TsOYE is indicated by oxidizing FMNH2 to FMN, the activity of soluble hydrogenase (SH) is shown in the consumption of H2, and the reduction of FMN to FMNH2. The experiment was performed as described in SI 3.2.
