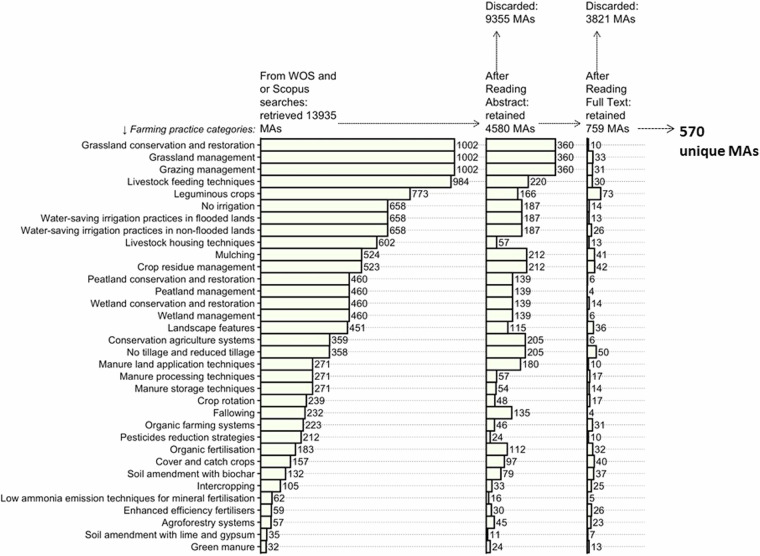
Fig. 3.
Graphical representation of the selection process leading to the systematic mapping applied to meta-analyses (MAs) published in the field of agriculture sustainability. The number of MAs retrieved from Web of Science and Scopus (after duplicate removal) is reported in the first bar-plot, for each of the 34 farming practice (FP) categories. The number of MAs retained and discarded after title-abstract reading and after full text reading is reported in the following two bar-plots. As some MAs were reporting results on more than one FP category, the final number of unique MAs selected for further data extraction is also reported.

