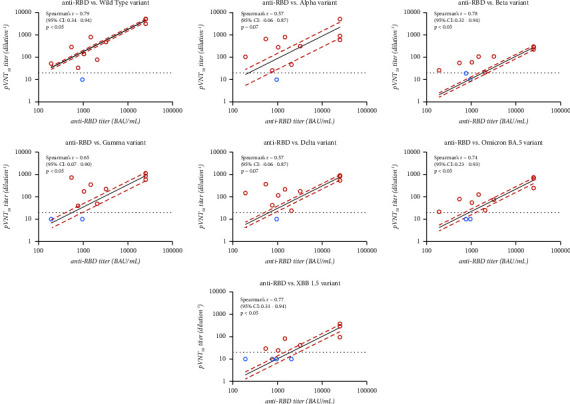
Figure 3.

Graphical representation of the correlation between the neutralizing antibody titers obtained in pVNT for the different variants and the total anti-RBD antibody titers obtained with the Elecsys anti-SARS-CoV-2 assay (Roche). Spearman's r represents the correlation and its 95% confidence interval (95% CI) is associated with each graph. Dots represented the results of AZD7442 individuals. Red dots are those for which a positive result was obtained for both techniques, while the blue dots represent a negative result in pVNT but positive in total antibodies.
