Table 4:
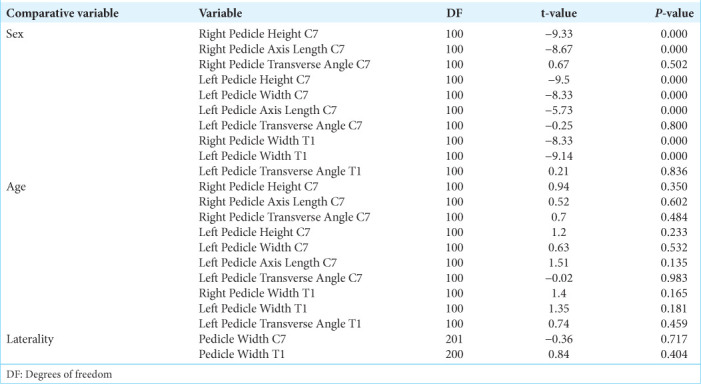
Results of the T-student tests. P-values that are highlighted in red represent comparisons with statistically different means.

Results of the T-student tests. P-values that are highlighted in red represent comparisons with statistically different means.
