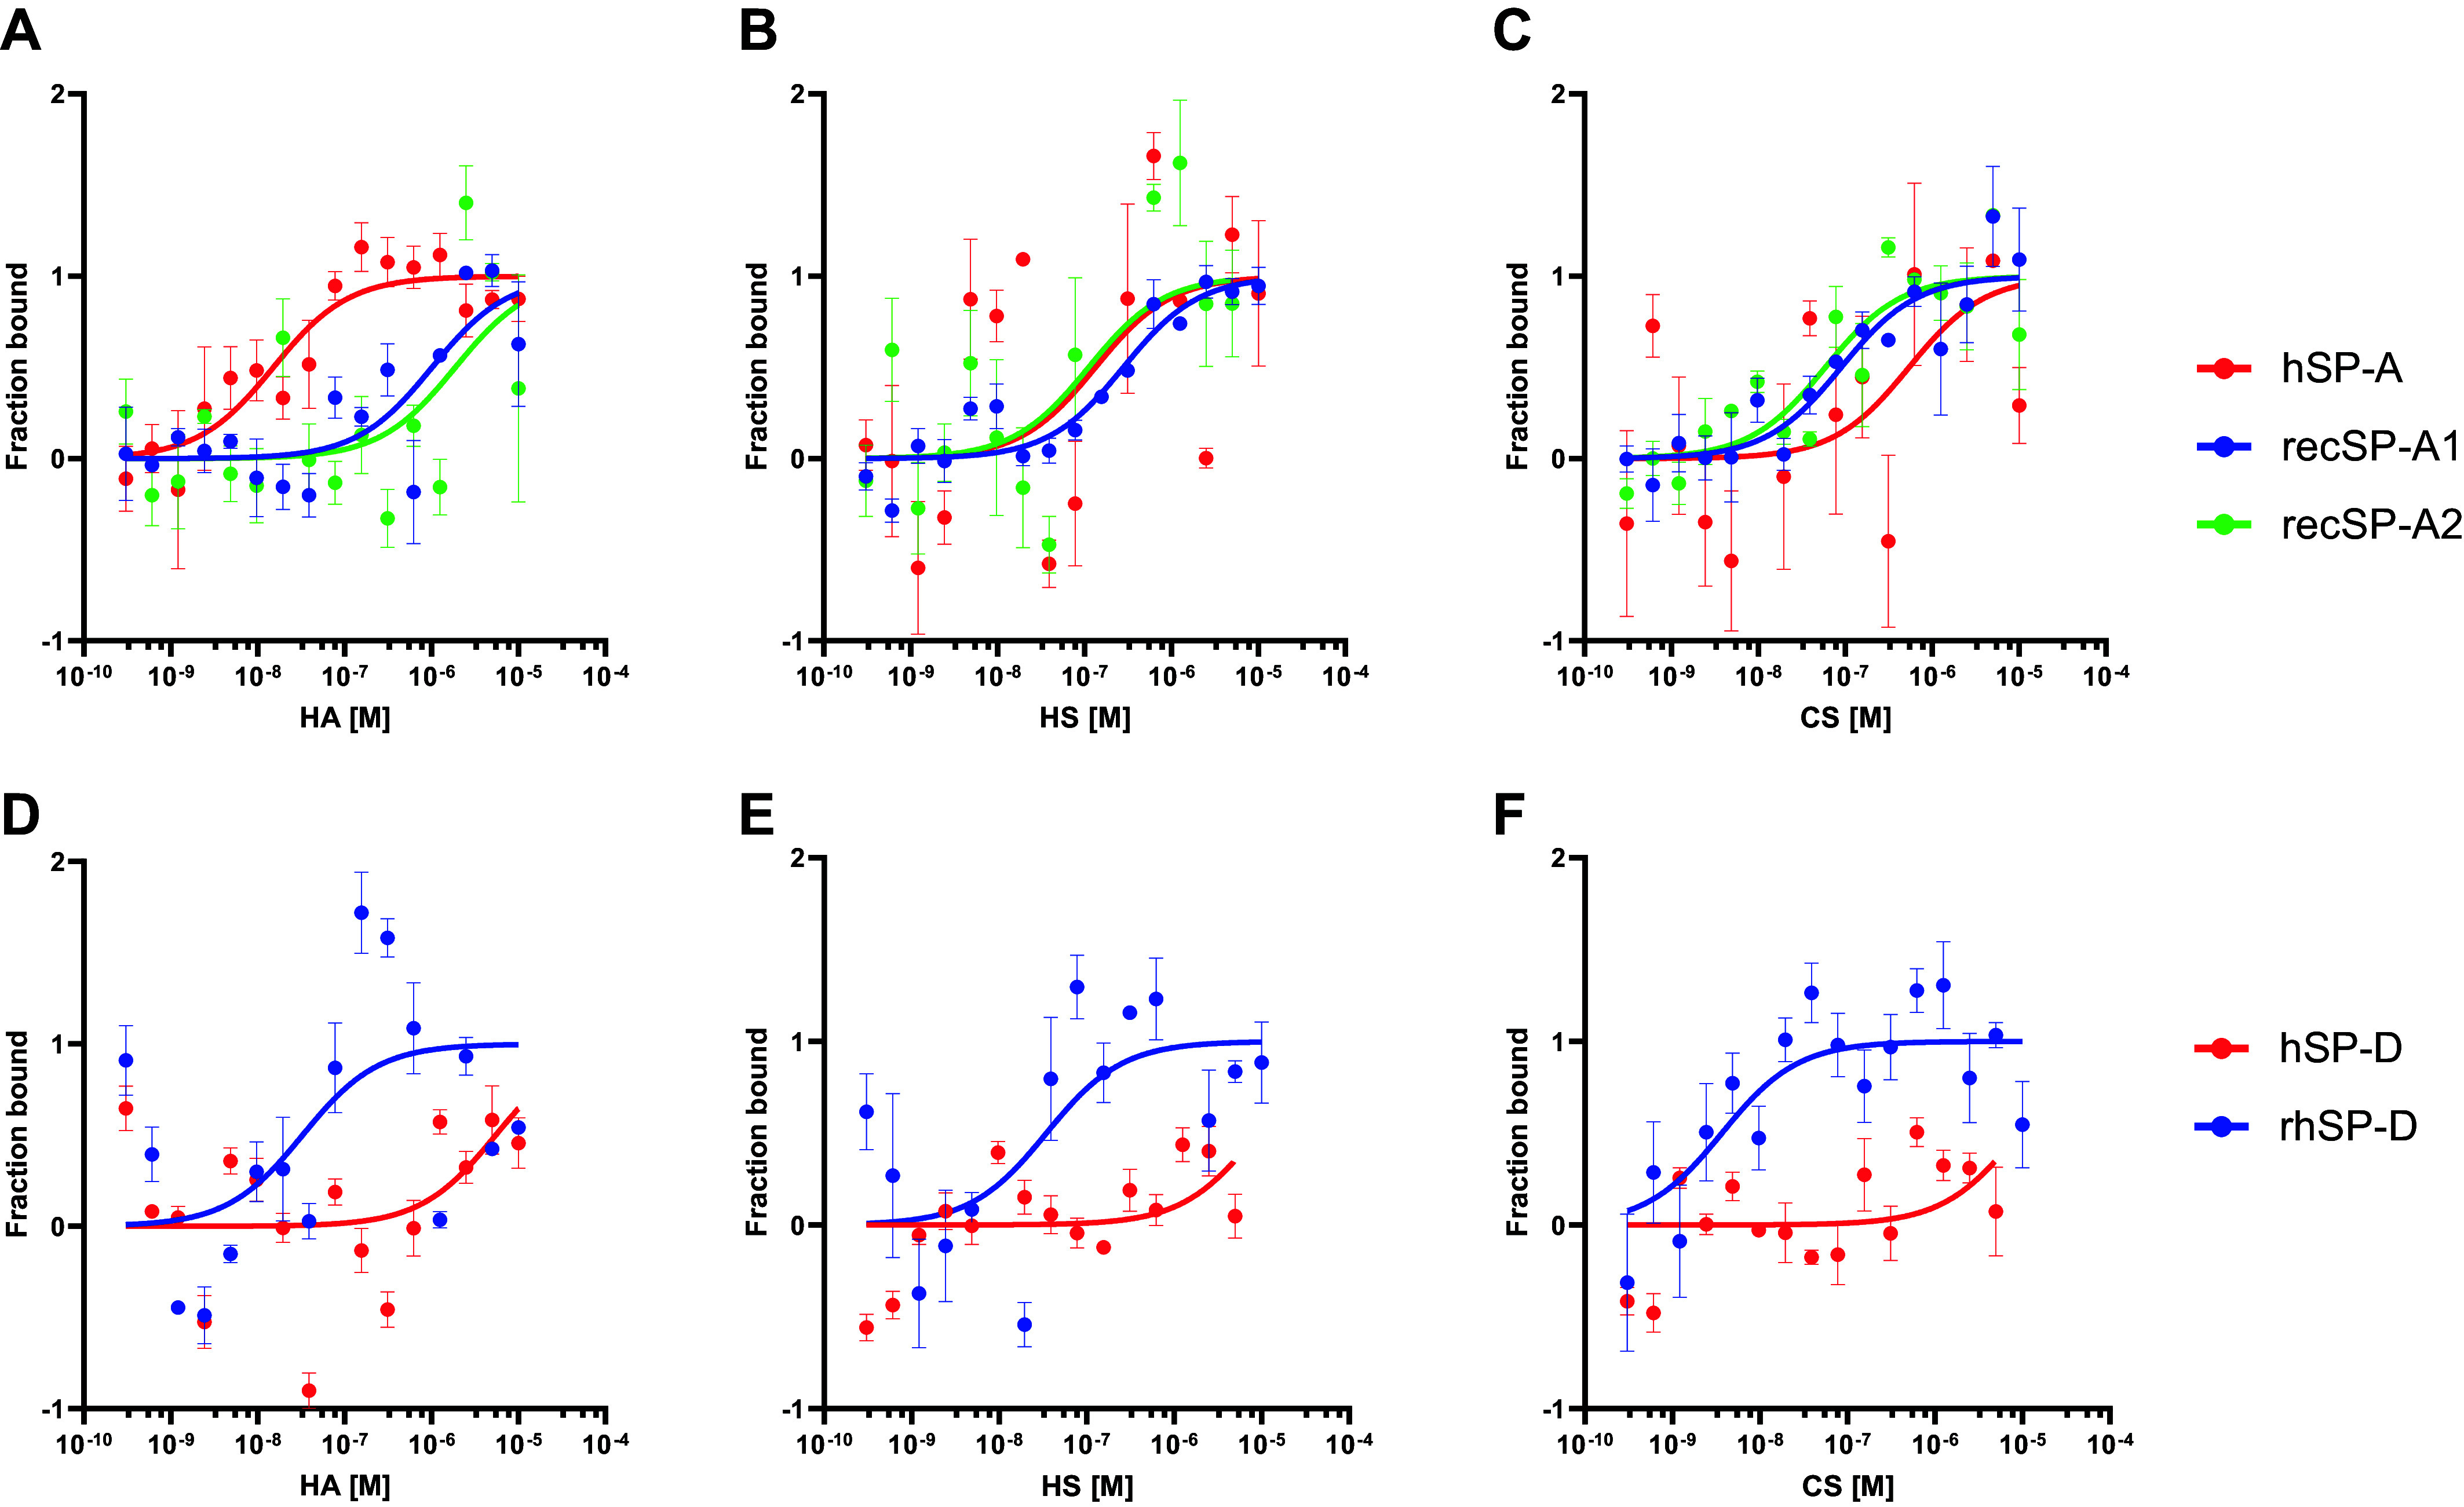
Figure 2.

Binding curves measured at the MST of SP-A and SP-D of different origin to GAGs. Top: binding of hSP-A (red), recSP-A1 (blue), and recSP-A2 (green) to: HA (A), HS (B), and CS (C). Bottom: binding of hSP-D (red) and rhSP-D (blue) to: HA (D), HS (E), and CS (F). Data are presented as means ± SEM of an n = 3–6 technical replicates. CS, chondroitin sulfate; GAG, glycosaminoglycan; HA, hyaluronan; HS, heparan sulfate; hSP-A, human SP-A; MST, microscale thermophoresis; SP-A, surfactant protein A; SP-D, surfactant protein D.
