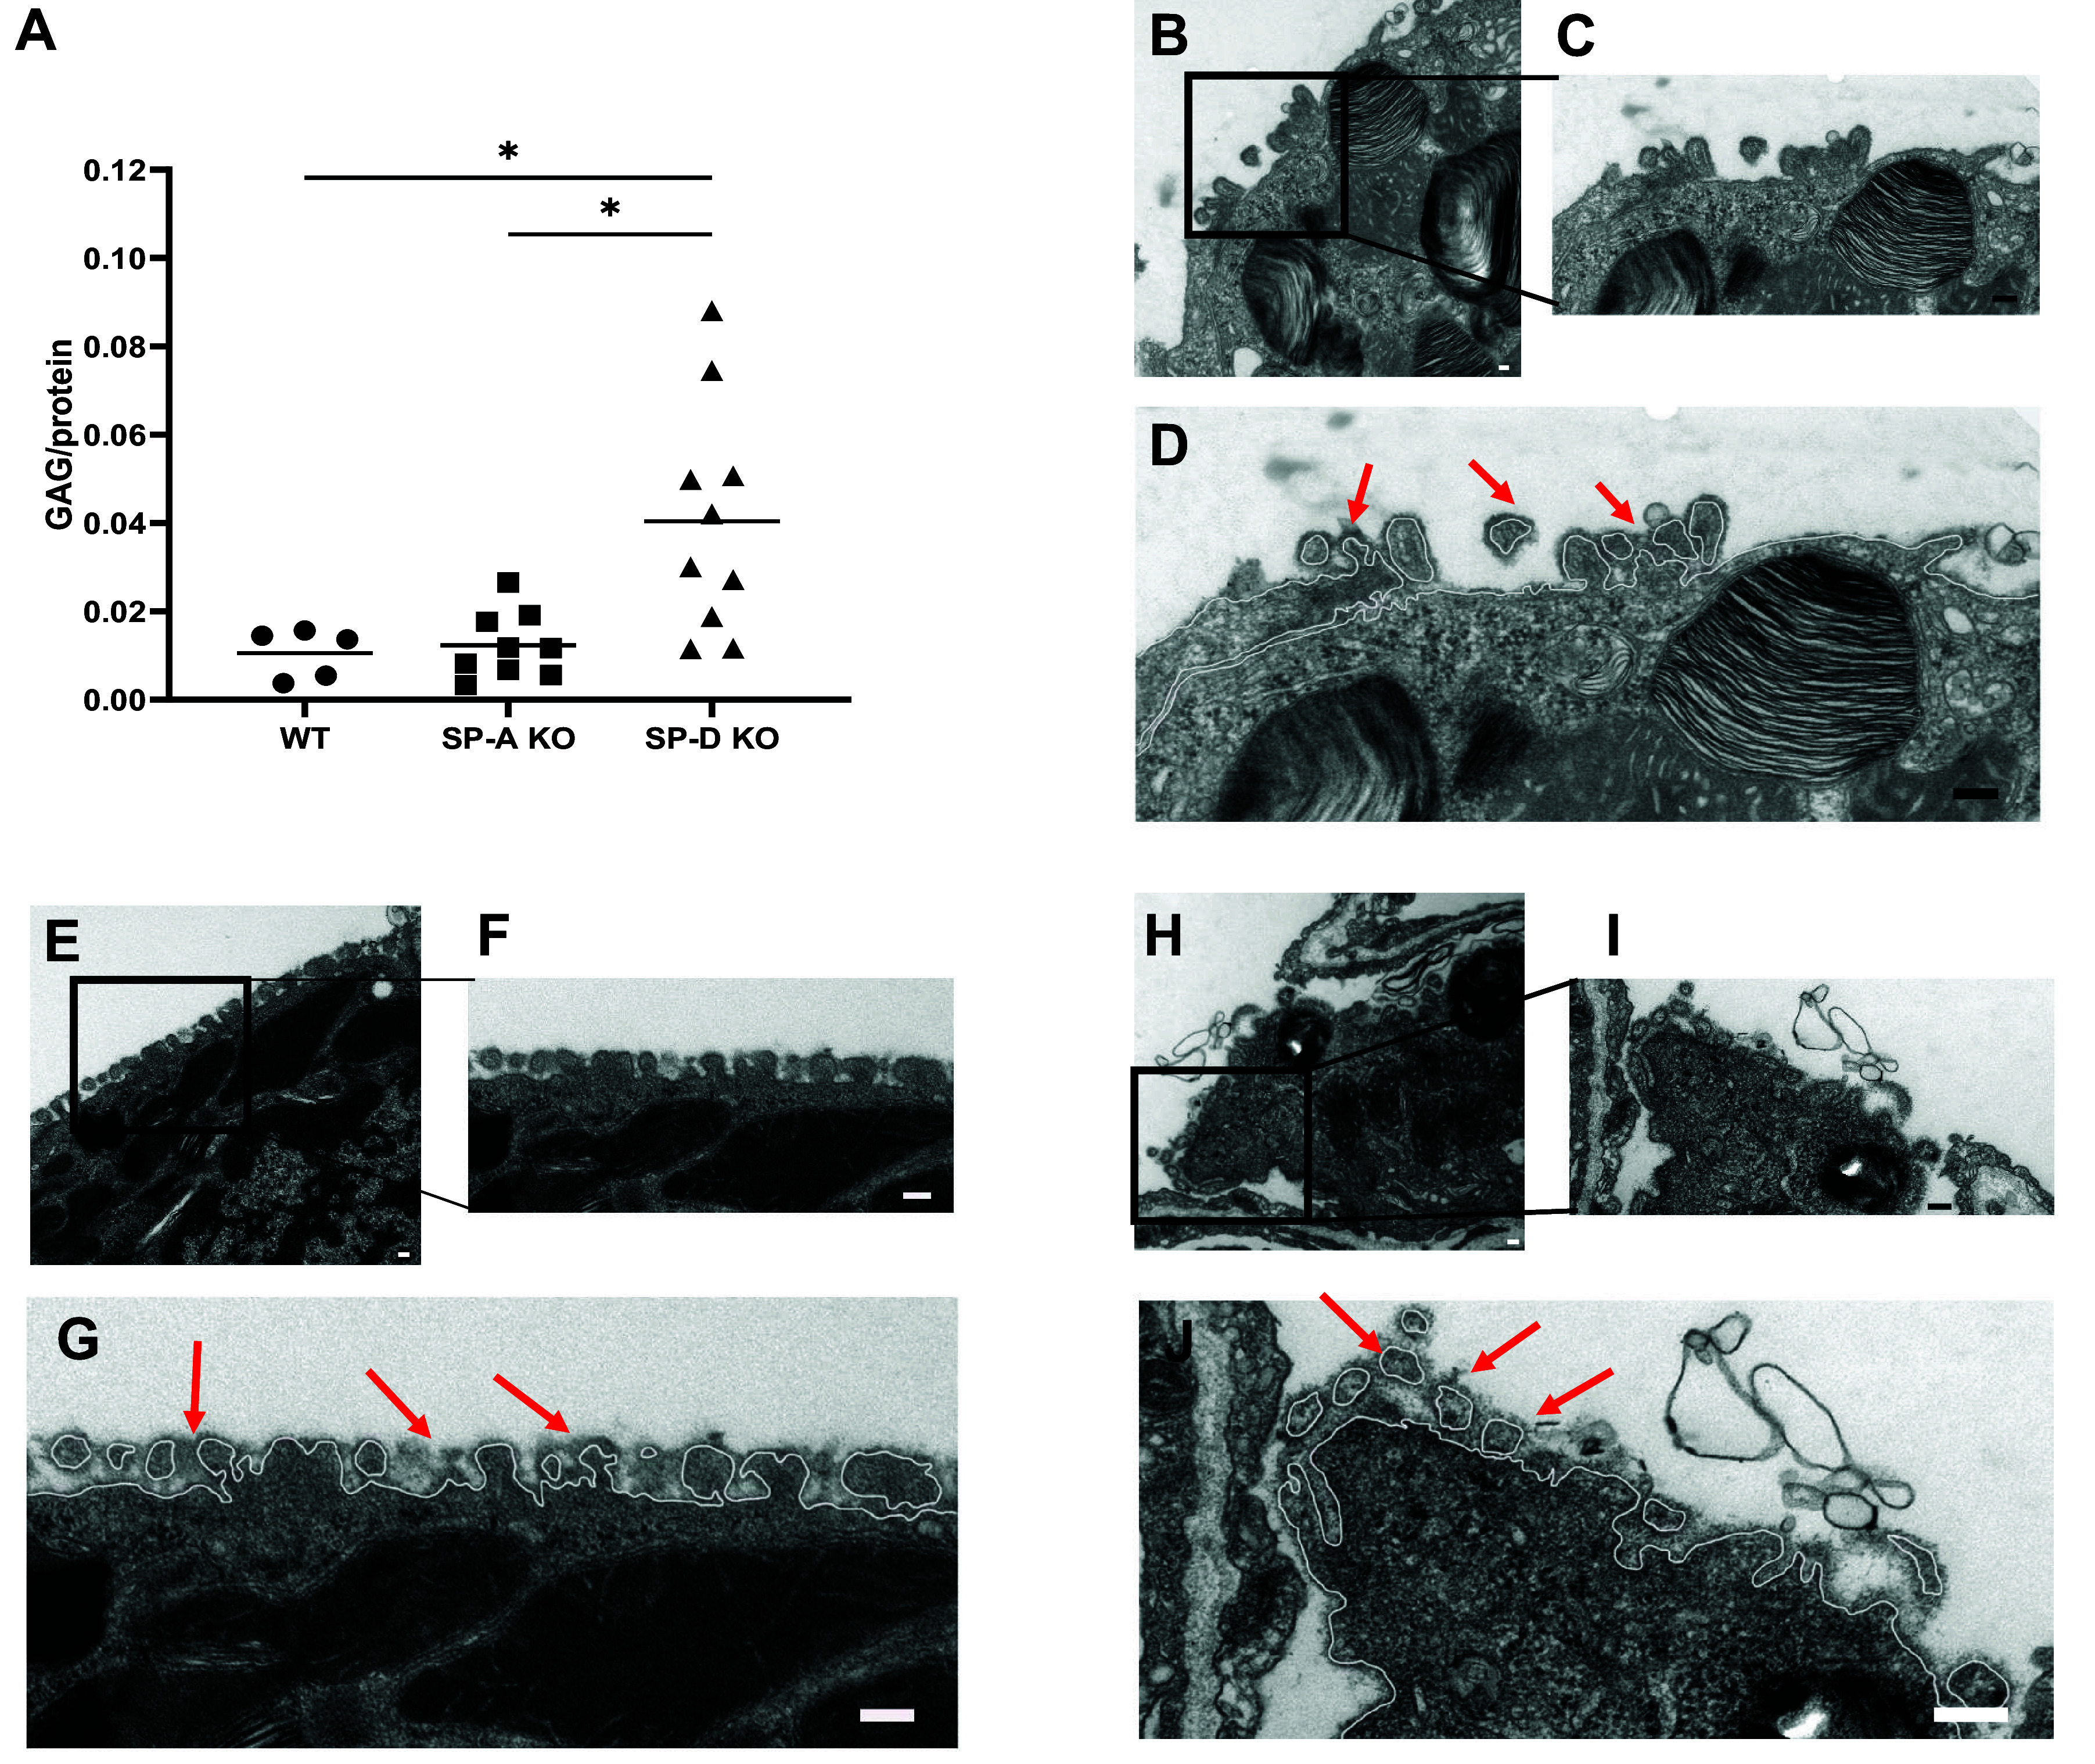
Figure 5.

A: quantification of GAGs in BAL from WT, SP-A KO, and SP-D KO mice, corrected by total protein in BAL. Alcian blue stained surface of microvilli of AE2C (B), higher magnification picture (C), and white line representing cell membrane and stained glycocalyx on top (red arrows) in WT mice (D). Alcian blue stained surface of microvilli of AE2C (E), higher magnification picture (F), and white line representing cell membrane and stained glycocalyx on top (red arrows) in SP-A KO mice (G). Alcian blue stained surface of microvilli of AE2C (H), higher magnification picture (I), and white line representing cell membrane and stained glycocalyx on top (red arrows) in SP-D KO mice (J). Data are presented as means ± SD of an n = 8–16 technical replicates, statistical significance was assessed with a non-parametric Kruskal–Wallis test considering *P < 0.05. Scale bar = 100 nm. BAL, bronchoalveolar lavage; GAG, glycosaminoglycan; SP-A, surfactant protein A; SP-D, surfactant protein D.
