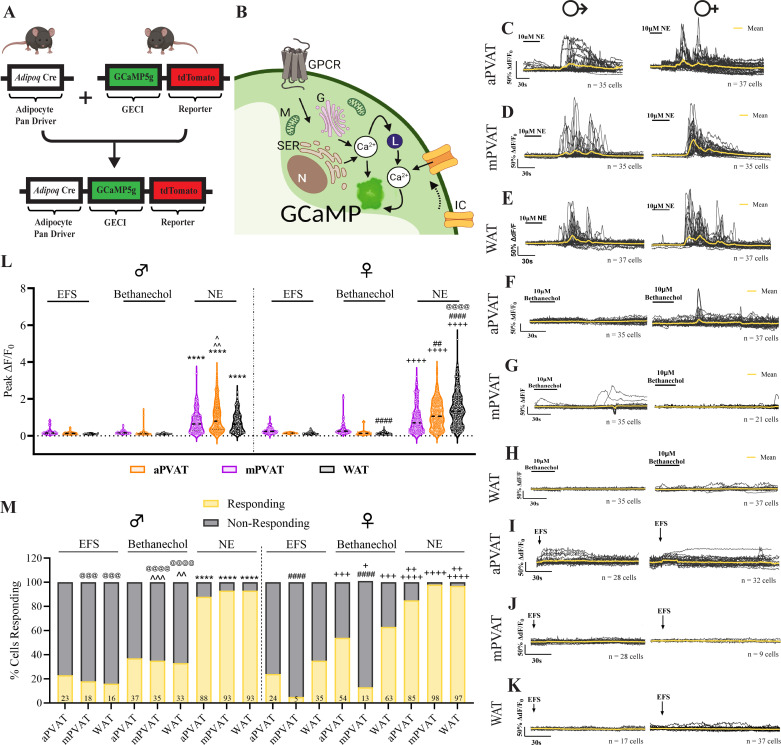
Figure 12.
Adipocytes are not functionally regulated by neural input. A: AdipoqCre+;GCaMPtdTf/Wt mice express the genetically encoded calcium indicator, GCaMP5g, and reporter protein, tdTomato, under control of the adipocyte pan driver, adiponectin. B: schematic depicting adipocyte activation involving increased cytoplasmic Ca2+ release from G protein-coupled receptor or ion channel activation. C–E: representative traces of male and female adipocyte responses (ΔF/F0) to bath application of 10 mM norepinephrine (NE) in aortic perivascular adipose tissue (aPVAT), mesenteric perivascular adipose tissue (mPVAT), and white adipose tissue (WAT), respectively (n = 17–37 cells). F–H: representative traces of male and female adipocyte responses to bath application of 10 mM bethanechol in aPVAT, mPVAT, and WAT, respectively (n = 21–37 cells). I–K: representative traces depicting male and female adipocyte responses to electrical field stimulation (EFS) (+100 V, 0.1 ms, 10 Hz, 1 pulse) in aPVAT, mPVAT, and WAT, respectively (n = 9–37 cells). L: quantification of peak adipocyte responses (peak ΔF/F0) to electrical field stimulation (EFS), bethanechol, and NE in male and female aPVAT, mPVAT, and WAT (n = 164–294 cells from 3 animals per experimental group). M: percentage of cells responding to EFS, bethanechol, and NE stimulation in male and female aPVAT, mPVAT, and WAT (n = 164–294 cells from 3 animals per experimental group). Statistical analyses was as follows: L: 3-way ANOVA, Tukey’s post hoc: ****P < 0.0001, male aPVAT NE vs. male aPVAT EFS and male aPVAT bethanechol, male mPVAT NE vs. male mPVAT EFS and male mPVAT bethanechol, male WAT NE vs. male WAT EFS and male WAT bethanechol. ^P = 0.0241, male mPVAT NE vs. male aPVAT NE. ^^P = 0.0021, male mPVAT NE vs. male WAT NE; ++++P < 0.0001 female aPVAT NE vs. female aPVAT EFS and female aPVAT bethanechol, female mPVAT NE vs. female mPVAT EFS and female mPVAT bethanechol, female WAT NE vs. female WAT EFS and female WAT bethanechol. ##P = 0.0011, female mPVAT NE vs. female aPVAT NE. ####P < 0.0001, female WAT NE vs. female aPVAT NE and female mPVAT NE, female aPVAT bethanechol vs. female WAT bethanechol. @@@@P < 0.0001, female WAT NE vs. male WAT NE. M: Fisher’s exact test, ^^P = 0.0015, male WAT EFS vs. male WAT bethanechol. ^^^P = 0.0002, male mPVAT EFS vs. male mPVAT bethanechol. ****P < 0.0001, male aPVAT NE vs. male aPVAT EFS and male aPVAT bethanechol, mPVAT NE vs. male mPVAT EFS and male mPVAT bethanechol, male WAT NE vs. male WAT EFS and male WAT bethanechol. +P = 0.0377, female mPVAT EFS vs. female mPVAT bethanechol. ++P = 0.0094, female aPVAT bethanechol vs. female aPVAT NE, ++P = 0.0015 female WAT bethanechol vs. female WAT NE, +++P = 0.0002 female aPVAT EFS vs. female aPVAT bethanechol, female WAT EFS vs. female WAT bethanechol; ++++P < 0.0001 female aPVAT NE vs. female aPVAT EFS bethanechol, female mPVAT NE vs. female mPVAT EFS and female mPVAT bethanechol, female WAT NE vs. female WAT EFS; ####P < 0.0001 female mPVAT EFS vs. female aPVAT EFS and female WAT EFS, female mPVAT bethanechol vs. female aPVAT bethanechol and female WAT bethanechol; @@@@P < 0.0001 male mPVAT bethanechol vs. female mPVAT bethanechol, male WAT bethanechol vs. female WAT bethanechol, @@@P = 0.0006 male WAT EFS vs. female WAT EFS, @@@P = 0.0001 male WAT bethanechol vs. female WAT bethanechol. G, Golgi; GECI, genetically encoded Ca2+ indicator; GPCR, G protein-coupled receptor; IC, ion channel; L, Lysosome; Lu, lumen; M, mitochondria; N, nucleus; Ser, smooth endoplasmic reticulum; VW, vessel wall. Images created with a licensed version of BioRender.com.

