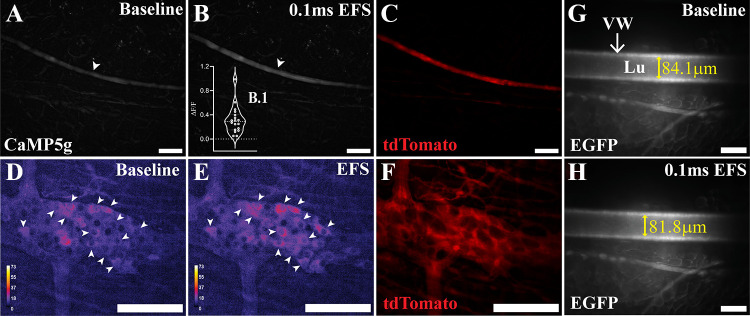
Figure 14.
Confirmation of electrical field stimulation. A–C: confirmation of electrical field stimulation (EFS) by imaging nerve fiber responses in the mesenteric perivascular adipose tissue (mPVAT) from Wnt1Cre+;GCaMPtdTf/WT mice (n = 3 males). A: representative image of baseline calcium activity in nerve fibers (white arrowhead) in the mPVAT (scale bar = 100 µM). B: representative image of nerve fiber responses to EFS (+100 V, 0.1 ms, 10 Hz, scale bar = 100 µM). C: representative image of tdTomato expression in nerves within the mPVAT of Wnt1Cre+;GCaMPtdTf/WT. D and F: confirmation of EFS by imaging neuron responses in the colon from Wnt1Cre+;GCaMPtdTf/WT mice (n = 1 female). D: baseline calcium activity in neurons (white arrowheads) in the circular myenteric plexus (scale bar = 100 mm). E: response of neurons to EFS (+100 V, 0.1 ms, 10 Hz, scale bar = 100 mm). Color scale indicates intensity of responses. F: expression of reporter protein tdTomato in neurons (scale bar = 100 mm). G and H: confirmation of EFS in enhanced green fluorescent protein (EGFP)-labeled vasculature in mPVAT from AdipoqCre+;RC-L-hMD3qf/Wt mice (n = 3 females). G: representative measurement of artery diameter in unstimulated mPVAT (84.1 mm, scale bar = 100 mm). H: representative decrease in artery diameter in response to EFS (+100 V, 0.1 ms, 10 Hz; 81.8 mm; scale bar = 100 mm).

