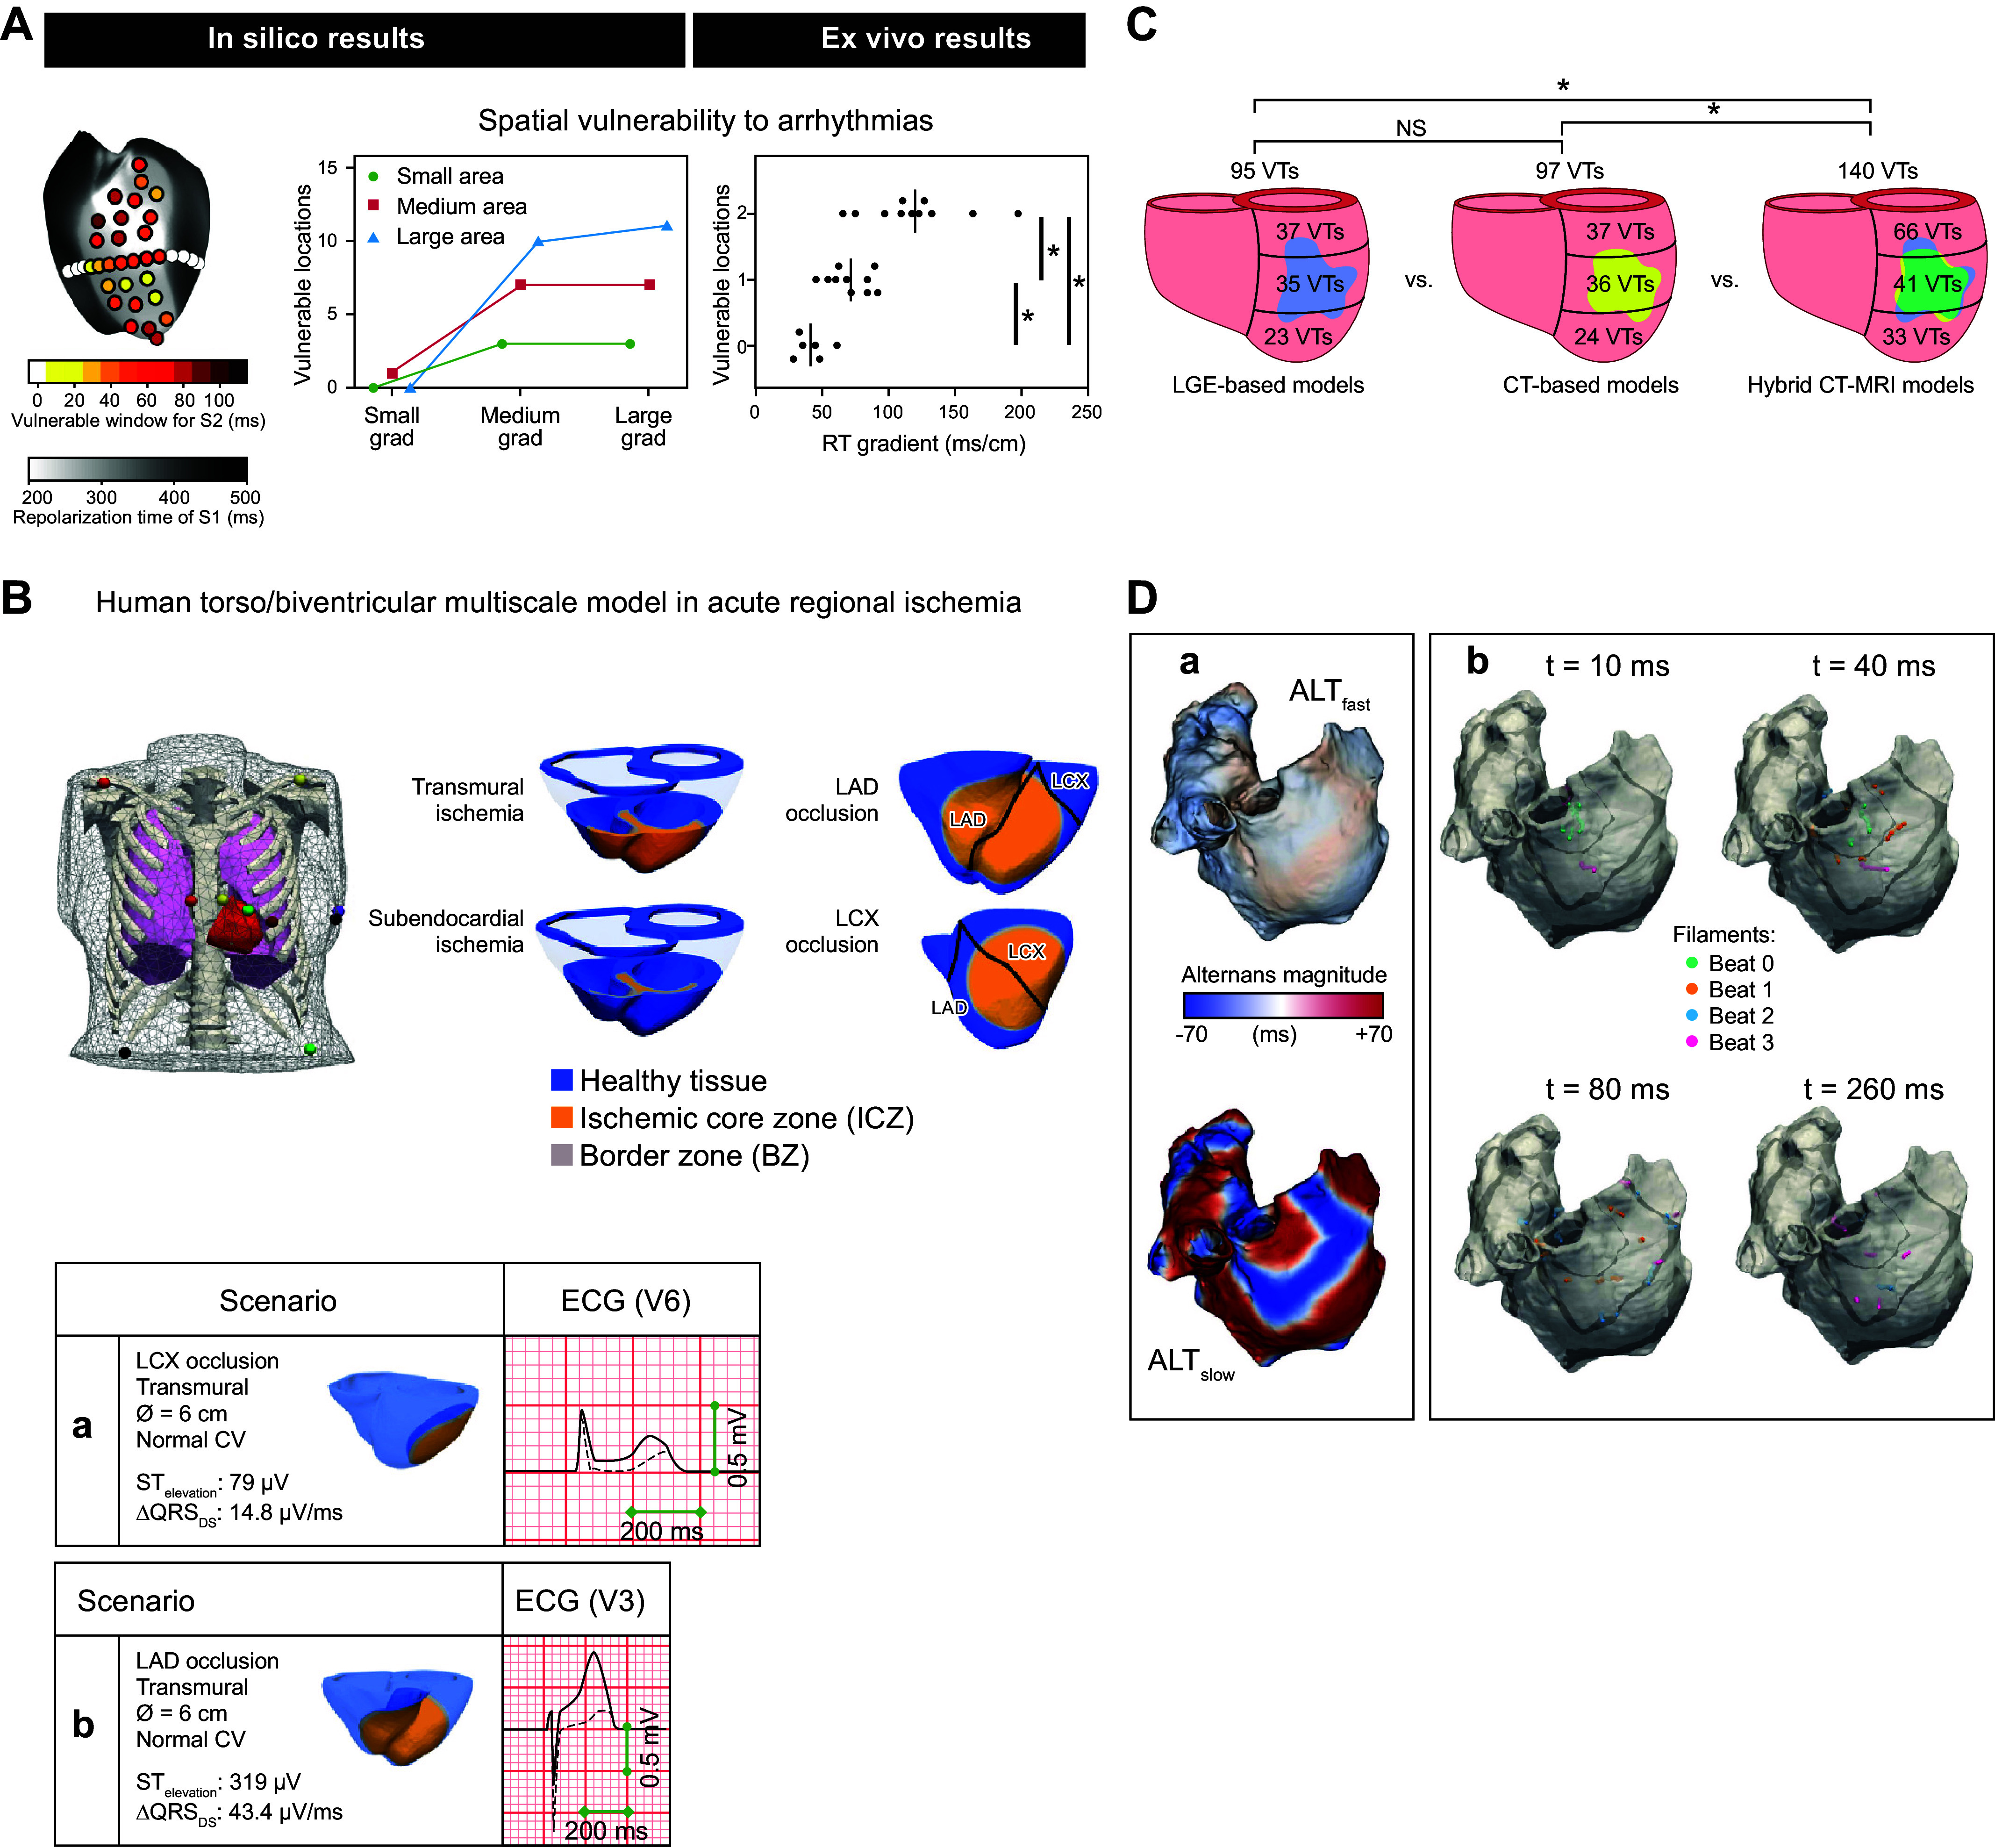
FIGURE 11.

Arrhythmogenic mechanisms in the human ventricles and atria. A: vulnerability for arrhythmias increases with steeper repolarization time gradients and larger early-repolarization regions. Left: arrhythmia inducibility is tested for various locations; the color reflects the size of the temporal vulnerable window (white indicates that no arrhythmia could be induced). Right: this was tested for 9 combinations of small, medium, or large gradients and small, medium, or large early-repolarization time (RT) areas. The computational model demonstrates that the spatial vulnerable region increased with a larger size of the early-RT area. In explanted hearts, there was an increasing number of inducible pacing locations at the early-RT region with steeper repolarization time gradients. *P < 0.05. Modified from Ref. 401, with permission from Science Translational Medicine. B, top: human torso/biventricular electrophysiology model in acute regional ischemia for ECG and arrhythmia simulations. Bottom: ECG alterations caused by acutely ischemic regions, for left circumflex (LCX; a) vs. left anterior descending (LAD; b) artery occlusion. CV, conduction velocity; QRSDS, QRS downslope. Modified from Ref. 402, with permission from Scientific Reports. C: arrhythmogenicity of penetrating adipose tissue (inFAT) versus scar, shown with 3 different heart models. Number and distribution of ventricular tachycardias (VTs) across the 3 models are shown. LGE, late gadolinium enhancement. NS, not significant. Reproduced from Ref. 273, with permission from Nature Cardiovascular Research. D: arrhythmogenesis arising from calcium-driven alternans in a model of human atrial fibrillation. Shown are discordant action potential duration (APD) alternans and filaments during fast pacing. a: APD alternans magnitude in ALTfast (top) and ALTslow (bottom) atrial models during pacing at 270-ms cycle length. The 2 atrial models use 2 different membrane kinetics: ALTfast, with single-cell alternans occurring only at fast pacing rates (cycle length ≤250 ms) and ALTslow, with single-cell alternans occurring at slower pacing rates (≤400 ms). b: nodal surfaces (black) and filaments (color) in ALTslow during 260-ms cycle length pacing. Snapshots show filament locations at different times after a paced beat from sinoatrial node region. Filaments from the first 4 beats are shown in different colors on the same snapshot for comparison. Reproduced from Ref. 403, with permission from Scientific Reports.
