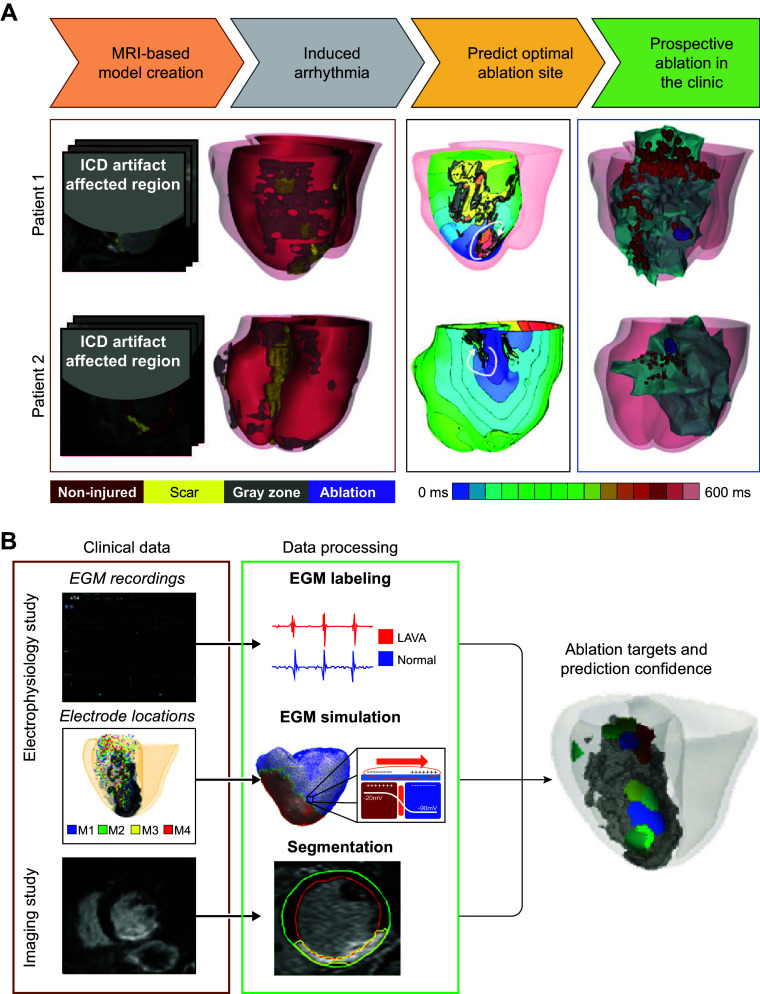
FIGURE 14.
Computational assistance in assessing reentrant circuits and guiding ventricular ablation. A, top: a flowchart summarizing the protocol (arrowed steps) and the retrospective and prospective studies. Bottom: results from the prospective human study, showing simulation-guided ablation for 2 patients with implantable cardioverter defibrillators (ICDs). Left: reconstructed ventricular models with different remodeled regions. Center: activation maps corresponding to the 2 ventricular tachyarrhythmia (VT) morphologies induced in the 2 patient heart models. White arrowheads depict the direction of propagation of the excitation wave. The color scale indicates activation times, and black indicates tissue regions that did not activate. Right: simulation-predicted ablation targets for the 2 VT morphologies. Coregistration of the simulation-predicted targets (purple) with the CARTO 3 endocardial surface (green). The red dots correspond to locations of the tip of the catheter during ablation. The left ventricular endocardial surface is shown in green, and the total infarct region is shown in gray. Noninjured and scar tissues are shown in red and yellow, respectively. Modified from Ref. 258, with permission from Nature Biomedical Engineering. B: model-based feature augmentation for ablation target learning from images. Modified from Ref. 260, with permission from Circulation: Arrhythmia and Electrophysiology. The pipeline shows the clinical data and the data processing, feature extraction, and learning stages. It shows electrogram (EGM) labeling (local abnormal ventricular activities, LAVA) used in the training process. Both simulated and image features are fed into the random forest algorithm for training. Ablation targets are predicted with the confidence in prediction provided. Modified from Ref. 529, with permission from IEEE Transactions on Biomedical Engineering.

