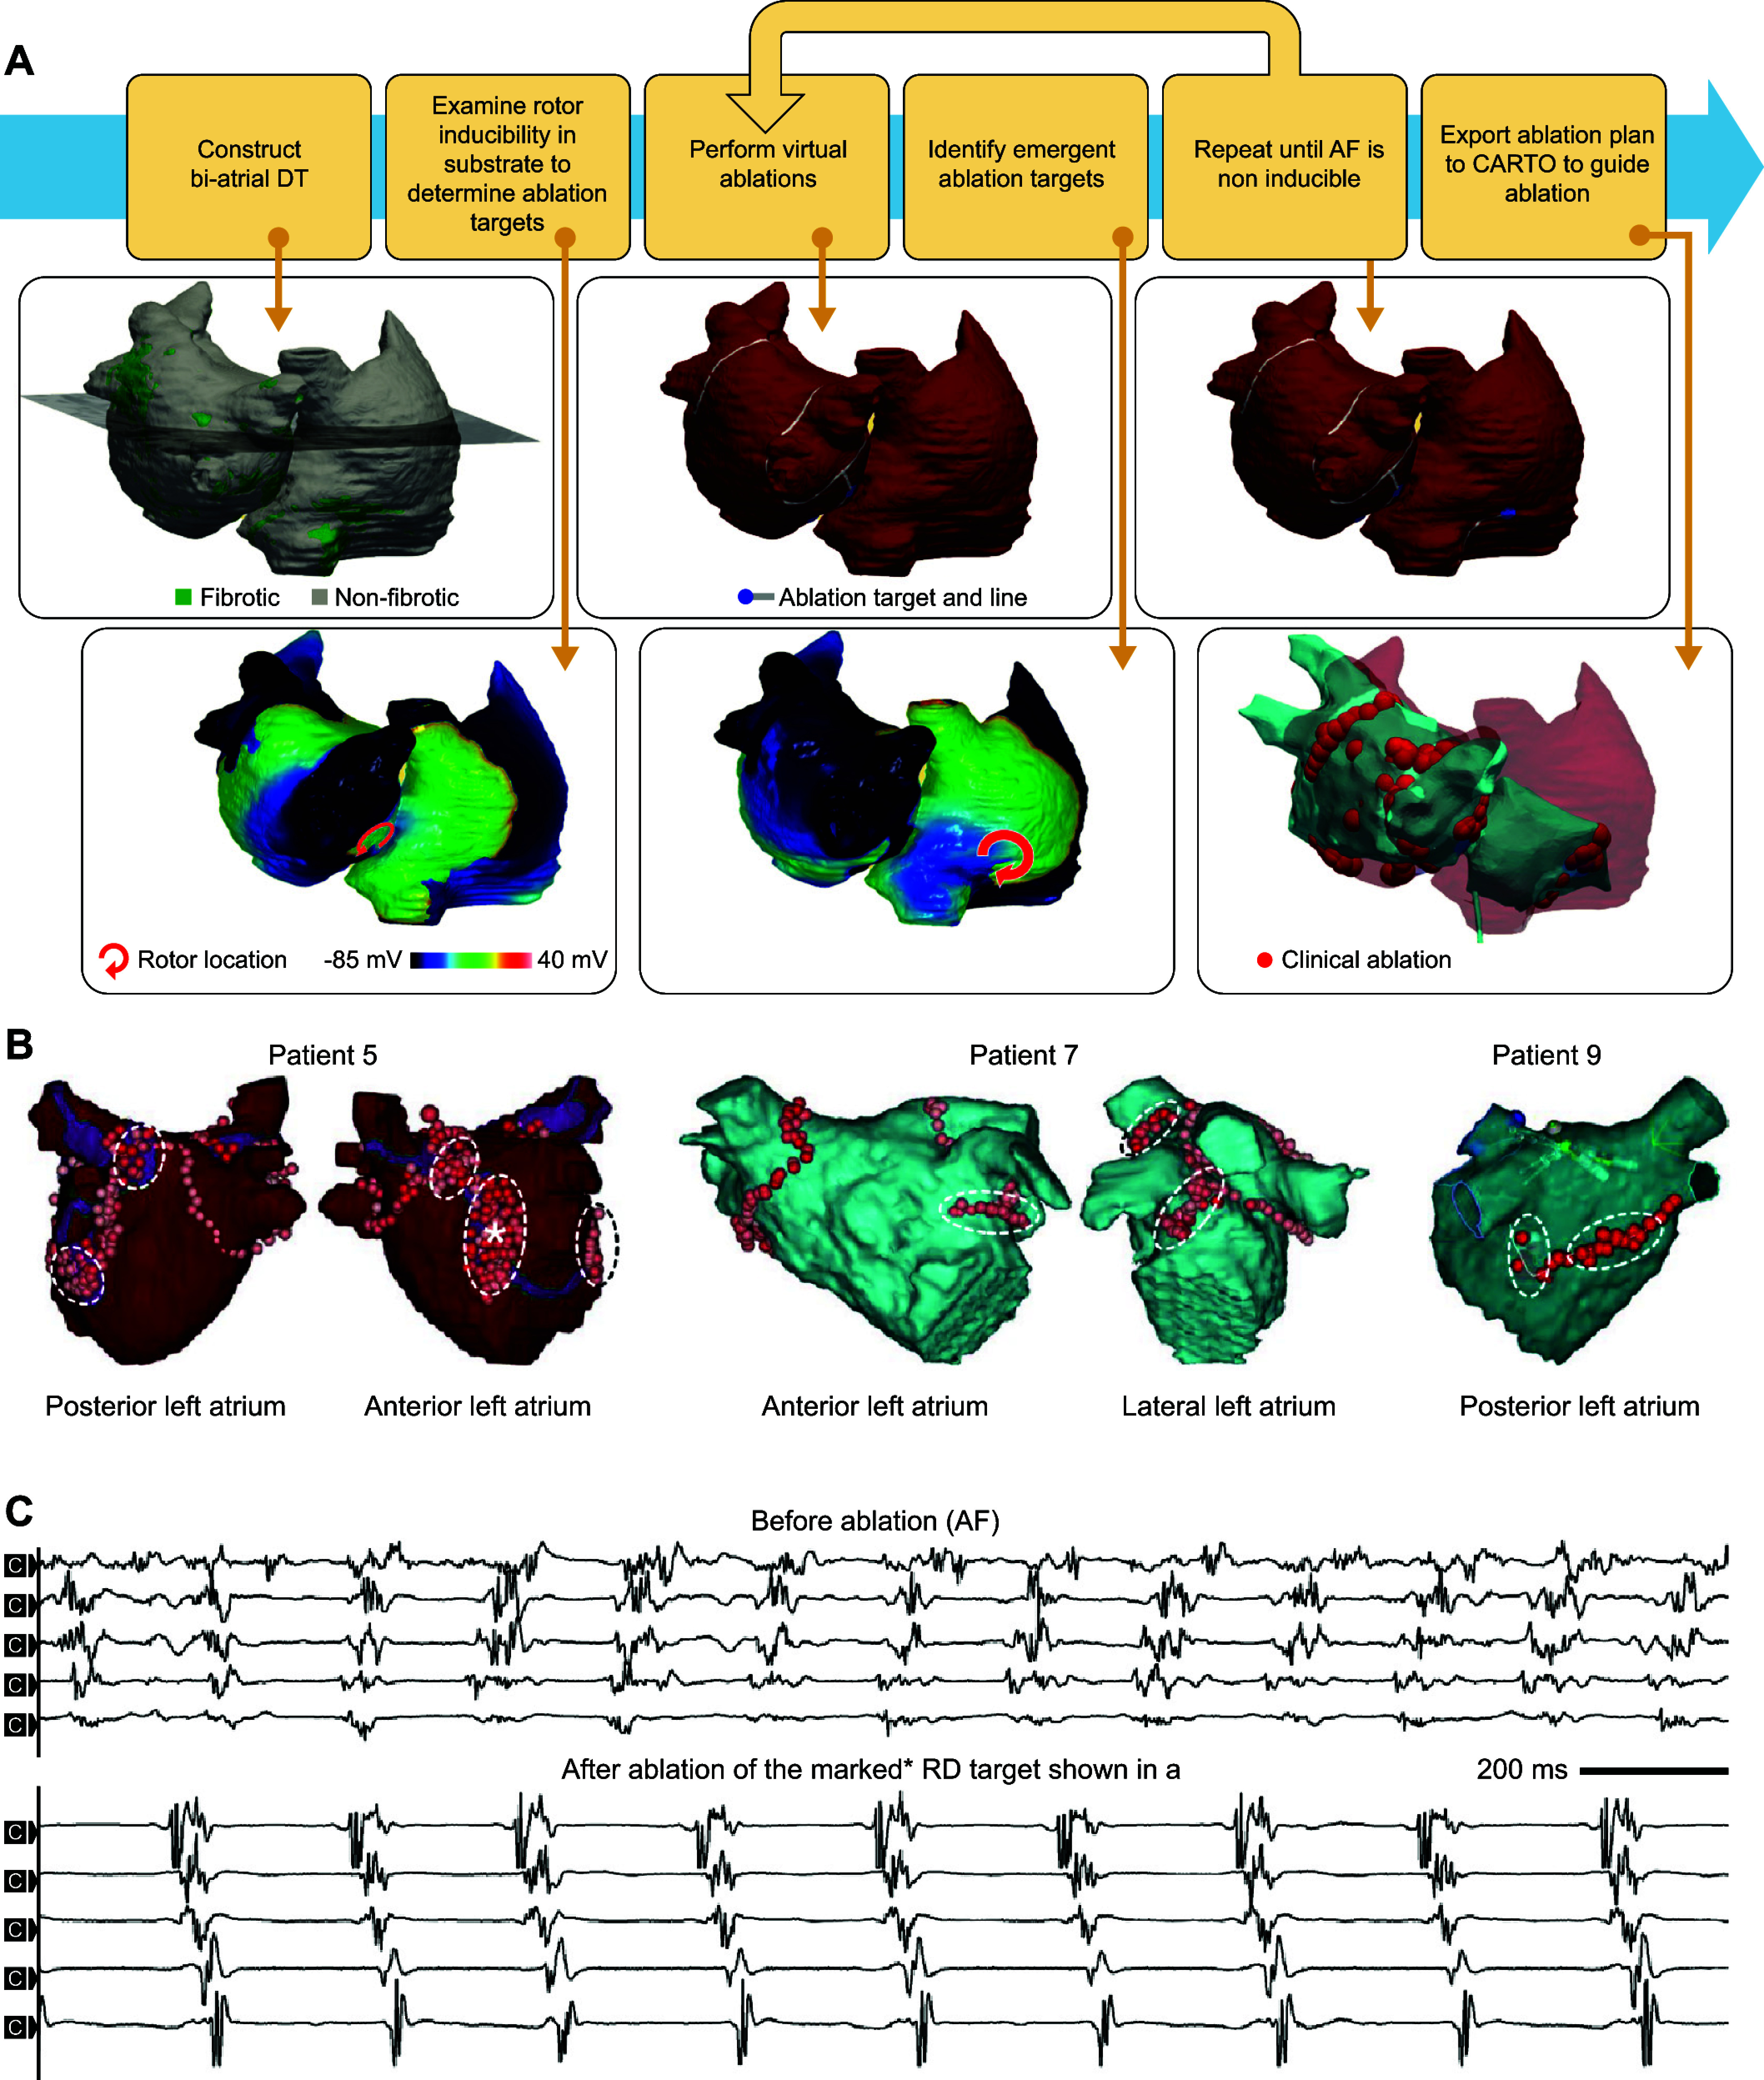
FIGURE 15.

Computational guidance of atrial fibrillation (AF) ablation and assessment of the fibrotic substrate. A: the OPTIMA approach. The individual steps are illustrated with the model of 1 of the participants in the study. Late gadolinium enhancement scans were used to construct the patient’s biatrial geometry and fibrosis distribution digital twin (DT). After a baseline inducibility test, 1 location at the left atrial anterior septal wall was determined to have a high likelihood of sustaining a rotor (bottom left). After virtual ablations targeting the detected location, a repeat inducibility test identified an emergent rotor location at the right atrial posterior region, which was then ablated. The final optimal ablation targets resulted in a complete arrhythmia noninducibility of the substrate. The proposed targets were imported to the CARTO system to guide ablation procedure. B: sites of ablation delivery (with catheter tip locations marked by red dots) in the left atrium, as rendered by the CARTO intracardiac mapping system at the end of the clinical ablation procedure in 3 patients. *Marked RD targets. Modified from Ref. 259, with permission from Nature Biomedical Engineering. C: bipolar electrogram recordings from a decapolar catheter placed in the coronary sinus of patient 5. In patient 5, ablation of the marked anterior left atrial target (shown in B by an asterisk for patient 5) resulted in a transient change from AF (top set of 5 electrograms) to an organized atrial tachycardia or flutter (bottom set of 5 electrograms). Modified from Ref. 259, with permission from Nature Biomedical Engineering.
