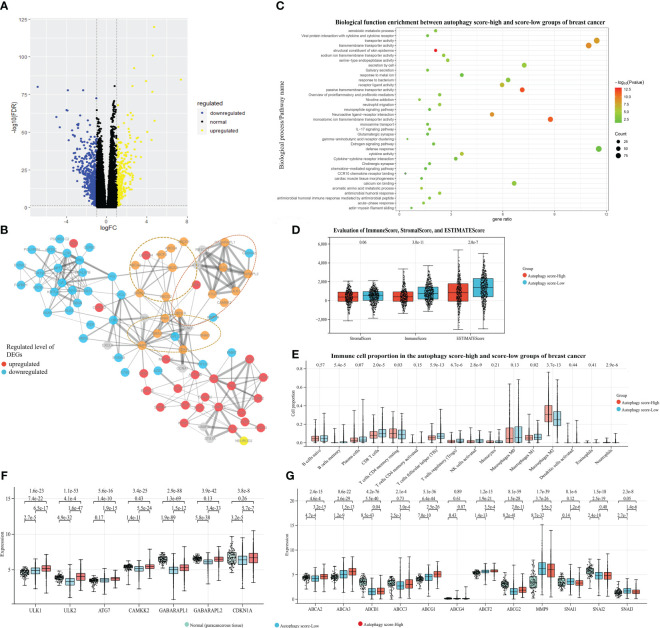
Figure 4.
Associations between autophagy and mRNA/protein expression, signaling pathways, and tumor microenvironment (TME), with breast cancer data taken as an example. Based on the TCGA-BRCA dataset and their autophagy-associated ssGSEA score, our study identified the 856 DEGs between the autophagy score-high and score-low breast cancer patient groups: (A) The volcano plot of DEGs. (B) The protein–protein interaction network from DEGs and autophagy/chemoresistance/metastasis-associated key genes. (C) The functional pathway enrichment of DEGs. (D) The ImmuneScore, StromalScore, and ESTIMATEScore of two groups. (E) The comparison of immune cell proportion between two groups. (F, G) The gene expression analysis among the paracancerous tissue and the autophagy score-high and score-low breast cancer samples, presented in log2(TPM+1) format.

