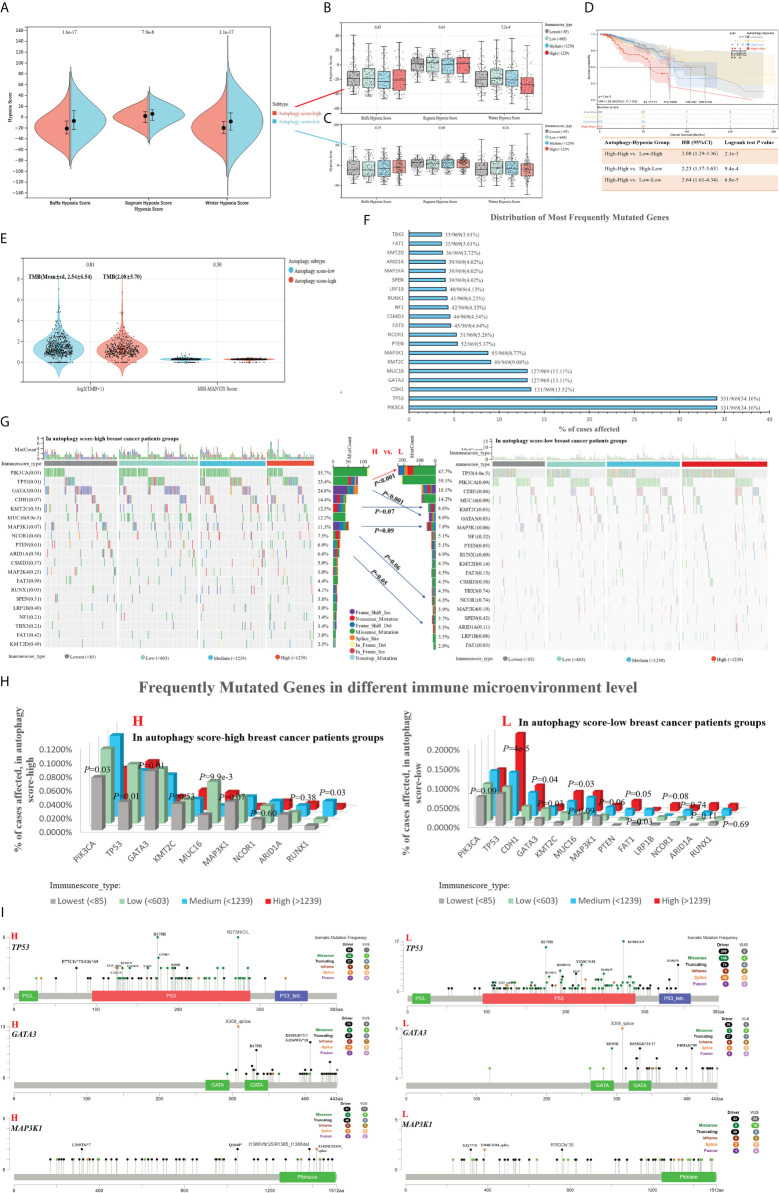
Figure 5.
Associations between autophagy status and hypoxia score, tumor genomic heterogeneity comparison, with breast cancer data taken as an example. (A) Based on hypoxia-related signatures, Winter score, Buffa score, and Ragnum score, we analyzed the difference of hypoxia level in the autophagy score-high vs. score-low subtypes. (B, C) In different immune infiltration levels, the analysis of hypoxia score in the autophagy score-high (B) and score-low breast cancer subtypes (C). (D) Survival analysis of individual autophagy status associated with hypoxia levels. (E) Tumor genomic heterogeneity analysis, TMB, and MSI, in the different autophagy status. (F) The top 15 most frequently mutated genes of breast cancer. (G–I) Gene mutation landscape in the autophagy score-high vs. score-low subtypes.

