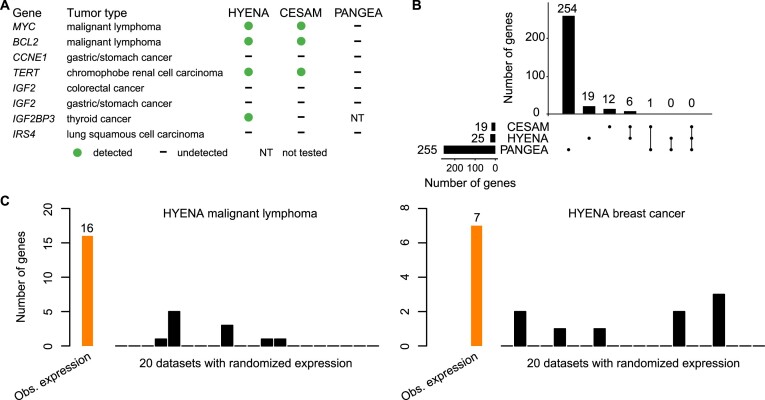
Figure 2.
Benchmarking HYENA. (A) Comparison of HYENA, CESAM, and PANGEA in detecting oncogenes known to be activated by enhancer hijacking in six tumor types from the PCAWG cohort. (B) UPSET plot demonstrating candidate genes identified and shared among the three tools in five tumor types of PCAWG. The numbers of candidate genes predicted by three algorithms are shown on the bottom left (19, 25 and 255). On the bottom right, individual dots denote genes detected by one tool, and dots connected by lines denote genes detected by multiple tools. The numbers of genes detected are shown above the dots and lines. For example, the dot immediately on the right of ‘PANGEA’ shows there are 254 candidate genes detected only by PANGEA but not CESAM and HYENA. The left most line connecting two dots indicates that there are six genes detected by both CESAM and HYENA but not by PANGEA. (C) Number of genes detected by HYENA in two PCAWG tumor types using observed gene expression and randomized expression. Genes detected in random expression datasets are false positives.

