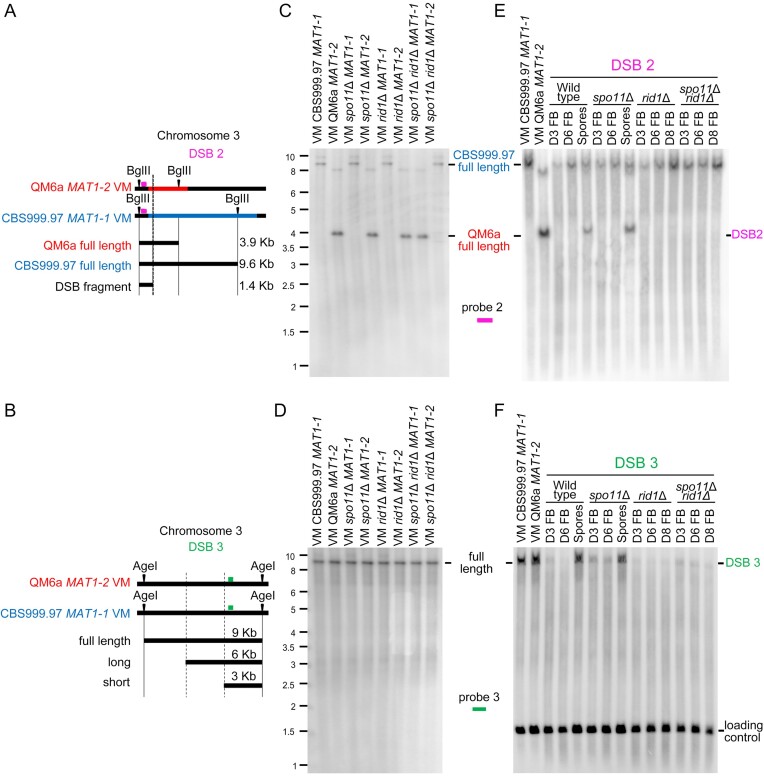
Figure 10.
The roles of rid1 and spo11 in initiation and repair of DSB2 and DSB3. (A) Restriction map of DSB2 on the third chromosome. Polymorphic DNA sequences in QM6a and CBS999.97(MAT11-1) are indicated in red and blue, respectively. The BglII restriction enzyme sites and the putative break site revealed by BND ssDNA enrichment experiments are indicated by black arrowheads and ‘X’, respectively. (B) Restriction map of DSB1 in the first chromosome of QM6a and CBS999.97(MAT1-1). The AgeI restriction enzyme sites and the two break sites revealed by our BND ssDNA enrichment experiment are indicated by two vertical lines, respectively. After AgeI digestion, the expected fragment sizes for the full-length band, ssDSB-1 (long), and ssDSB-2 (short) are designated. The location of the DNA probe (in green) used for Southern hybridization is shown above the chromosome (C–F) Southern hybridization. After BglII or AgeI digestion, the expected fragment sizes for the full-length DNA bands, DSB2 and DSB3 are designated. The location of the two DNA probes (in pink and orange) used for Southern hybridization are shown above the chromosome. (C, D) Southern hybridization of gDNA isolated from eight haploid maternal and paternal vegetative mycelia (VM). (E, F) Southern hybridization of gDNA isolated from the corresponding fruiting bodies (FBs) harvested at indicated days after the initiation of sexual crosses, as well as the mature ascospores released from the indicated fruiting bodies. After BglII digestion, the smp3 DNA was used as the loading control for Southern hybridization (Supplementary Figure S24A). After AgeI digestion, the act1 DNA was used as the loading control for Southern hybridization (F). Visualization/quantification of Southern hybridization band intensity was performed using a BAS-IP MS204 phosphorimaging plate (Cytiva, Japan) with a Typhoon 5 biomolecular imager (Cytiva, Japan).

