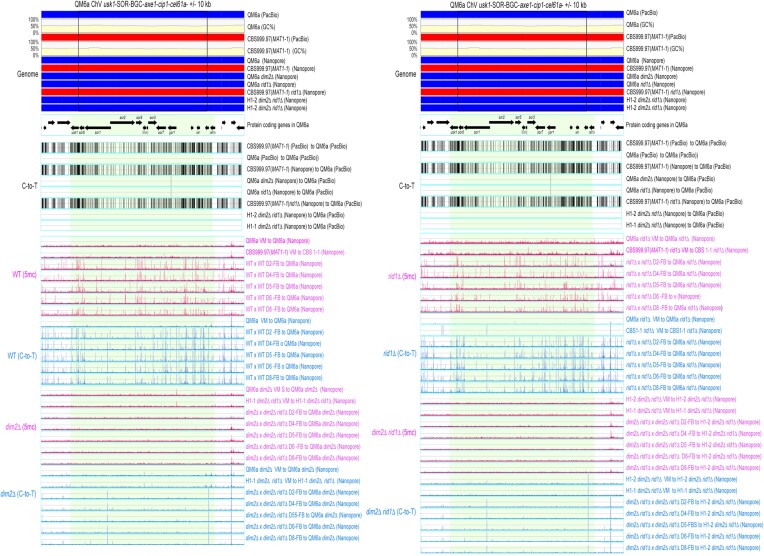
Figure 3.
The 5mC (in blue; BS+/NGS) and C-to-T mutation (in pink; BS−/NGS) profiles in RCS1-GTX. RCS1-GTX contains the GTX-BGC chromosomal region and its upstream 10 kb and downstream 10 kb sequences. The two boundaries of GTX-BGC are indicated by two vertical black lines. Genomic DNA was isolated from indicated vegetative mycelia (VM) of the two parental haploid strains, as well as the fruiting bodies (FB) at different days (D2-D8) after initiating sexual crosses of WT (WTH0011) × WT (WTH0015), dim2Δ (WTH13060) × rid1Δ dim2Δ (WTH13147), rid1Δ (WTH13058) × rid1Δ (WTH13059) and rid1Δ dim2Δ (WTH13215) × rid1Δ dim2Δ (WTH13147), respectively (Table 1). The results of BS− and BS+ NGS gDNA-seq were analyzed and visualized using ‘TSETA’ (58,59). The reference genome sequences of QM6a (WTH0011) and CBS999.97(MAT1-1) (WTH0015) determined by PacBio RSII technology (11) are indicated in red and blue, respectively. The GC contents (window size = 500 bp) for the telomere-to-telomere sequence of the sixth chromosome of QM6a are shown in yellow. The protein-coding genes in QM6a were visualized by arrows. The near-complete genome sequences of seven haploid parental strains were determined by Oxford Nanopore Technology, and their nucleotide sequences identical to the two reference genomes are visualized in blue and red, respectively. Compared to the genome sequence of QM6a, all C-to-T allelic variants in the genomes of CBS999.97(MAT1-1) and the seven parental haploid genomes are indicated by vertical black lines and were excluded to enable identification of newly generated C-to-T mutations.

