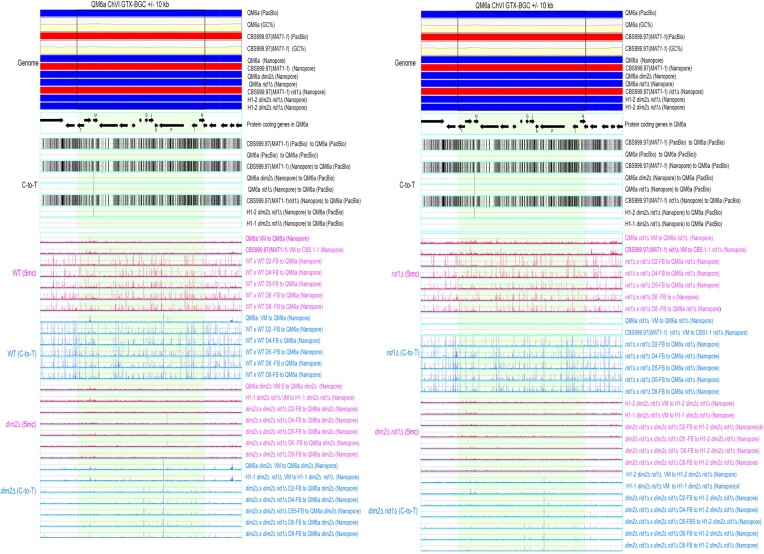
Figure 4.
The 5mC (in blue; BS+/NGS) and C-to-T mutation (in pink; BS−/NGS) profiles in RCS2-SOR. RCS2-SOR contains the usk1-SOR-BGC-axe1-cip1-cel61a chromosomal region and its upstream 10 kb and downstream 10 kb sequences. The two boundaries of usk1-SOR-BGC-axe1-cip1-cel61a are indicated by two vertical black lines. All results were analyzed and visualized as described in Figure 3.

