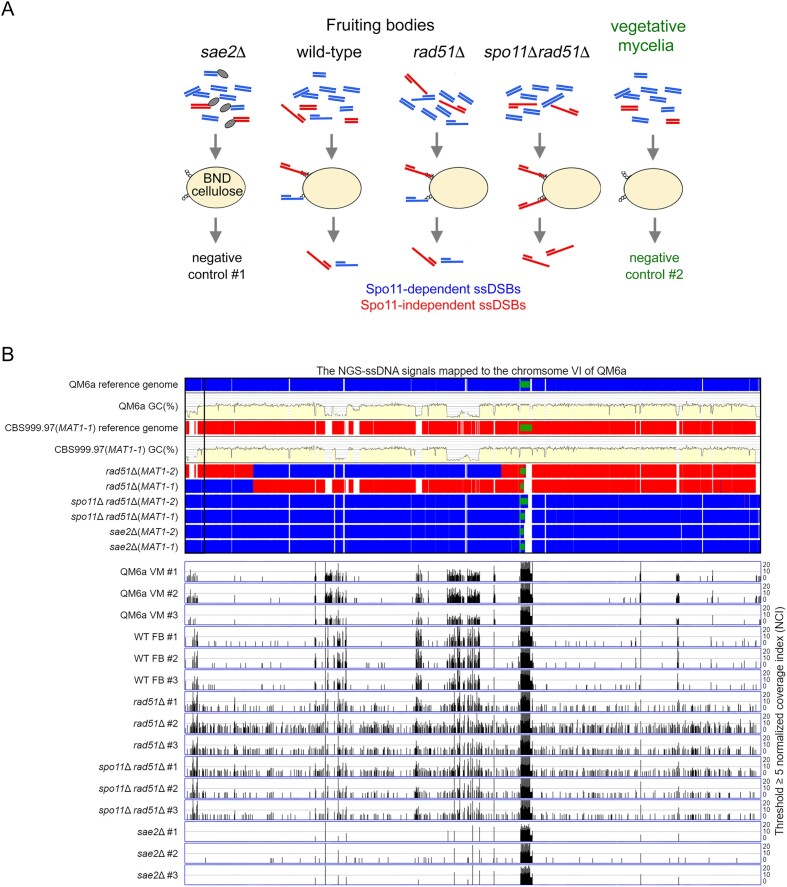
Figure 7.
Genome-wide mapping of ssDNA-associated DSBs (ssDSBs) in wt, rad51Δ and rad51Δ spo11Δ fruiting bodies (FB). (A) Schematic illustrating the ssDNA enrichment procedures using BND cellulose, as described previously (65). The ssDNAs formed in QM6a (WHY00015) × CBS999.97(MAT1-1) (WHY00011), rad51Δ (WTH12867) × rad51Δ (WTH12794) and spo11Δ rad51Δ (WTH12901) × spo11Δ rad51Δ (WTH12902) FBs, as well as those from QM6a (WHY00015) and CBS999.97(MAT1-1) vegetative mycelia, were enriched employing BND cellulose. The ssDNAs isolated from the sae2Δ (WTH13049) x sae2Δ (WTH13040) FBs and from QM6a and CBS999.97(MAT1-1) vegetative mycelia were used as negative controls. All experiments were performed in triplicate(see Materials and methods). (B) The enriched ssDNA peaks along the sixth chromosome were identified using a threshold of ≥ 5 normalized coverage index (NCI) (see Materials and methods). The reference genome sequences of QM6a (WTH0011) and CBS999.97(MAT1-1) (WTH0015) determined by PacBio RSII technology (11) are indicated in red and blue, respectively. The GC contents (window size 500 bp) for the telomere-to-telomere sequence of the sixth chromosome of QM6a are shown in yellow. The near-complete genome sequences of six haploid parental strains were determined by Oxford Nanopore Technology, and their nucleotide sequences identical to the two reference genomes are visualized in blue and red, respectively. The two telomeric sequences and each 45S rDNA array are indicated by black empty and green solid rectangles, respectively. The raw sequencing reads from each sample were mapped to the QM6a genome using the BWA (v0.7.17) alignment tool (66). We used the package BAMscale (v1.0) to quantify the sequencing peaks and normalize the coverage tracks across all samples (67). Using its ‘scale’ function, peak coverages were calculated based on the sum of per-base coverage of reads and then scaled to 1× genome coverage. The resulting values of ‘normalized coverage index’ are referred to as NCI. QM6a and CBS999.97(MAT1-1) vegetative mycelia (VM) and the three sae2 FBs were used as negative controls. All experiments were performed in triplicate.

