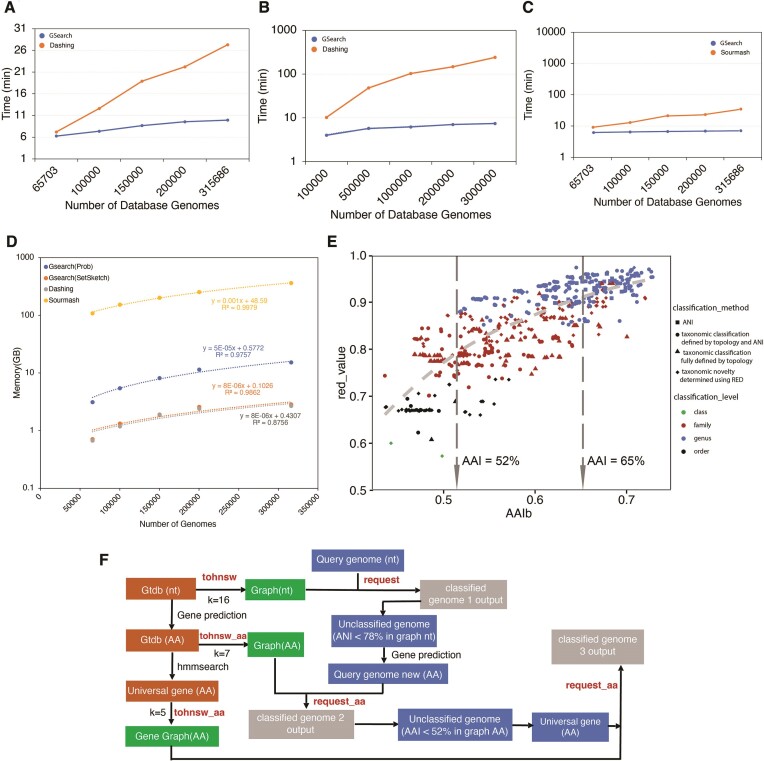
Figure 3.
Running time, memory consumption and classification accuracy of GSearch against Dashing, Sourmash and BLAST-based ANI/AAI tools. (A) Running time of GSearch versus Dashing for searching 8466 query genomes against the RefSeq prokaryotic genome database as a function of the number of genomes used in the database (x-axis) at the nucleotide level. (B) Running time of GSearch (blue) versus Dashing (orange) for 10 000 query viral genomes against the IMG/VR v4 database at amino acid level. (C) Same as in (A) above but comparison is against Sourmash multisearch (orange). (D) Memory consumption of GSearch versus Dashing and Sourmash search. Search is to load database into memory, thus maximum memory is directly related to database size. Since Sourmash search is not parallelized, GNU parallel was used for process-level parallelism. Note that y-axis values are in log scale in panels (B)–(D). (E) Comparison of GSearch classification results with GTDB-Tk and Blastp-based AAI tools for moderate-to-distantly related query genomes based on the bacterial proteome database (e.g. ANI between the query genome and its best match in the database was lower than 78% for these genomes). Each point represents a comparison between two genomes, query and the best match found by GSearch, showing RED values generated by GTDB-tk (y-axis) versus Blastp-based AAI between these two genomes. The taxonomic rank that the query and the best database match share is shown (see figure key). Two vertical lines indicate Blastp-based AAI threshold for family and genus level classification threshold. Note that the best match was always the same genome between GSearch and all vs. all Blastp AAI, and the overall consistency between GSearch/AAI and GTDB-tk in identifying the same best database genomes for the same query genomes. (F) Overview of GSearch's 3-step pipeline for classifying prokaryotic genomes. Orange boxes denote steps that aim to prepare genome files, in different formats, for graph building while green boxes denote building steps of the graph database (in nucleotide or amino acid format). Blue boxes indicate input/query genomes to search against the database while grey boxes indicate classification output for each input. Two key steps of GSearch: tohnsw and request are used to build graph database and request (or search) new genomes against the database, respectively. Two thresholds are used in the pipeline to decide between whole nucleotide vs. whole-genome amino acid search and whole-genome amino acid vs. universal gene amino acid; that is, 78% ANI and 52% AAI, corresponding to Probminhash distance 0.9850 and 0.9375, respectively (see main text for details).

